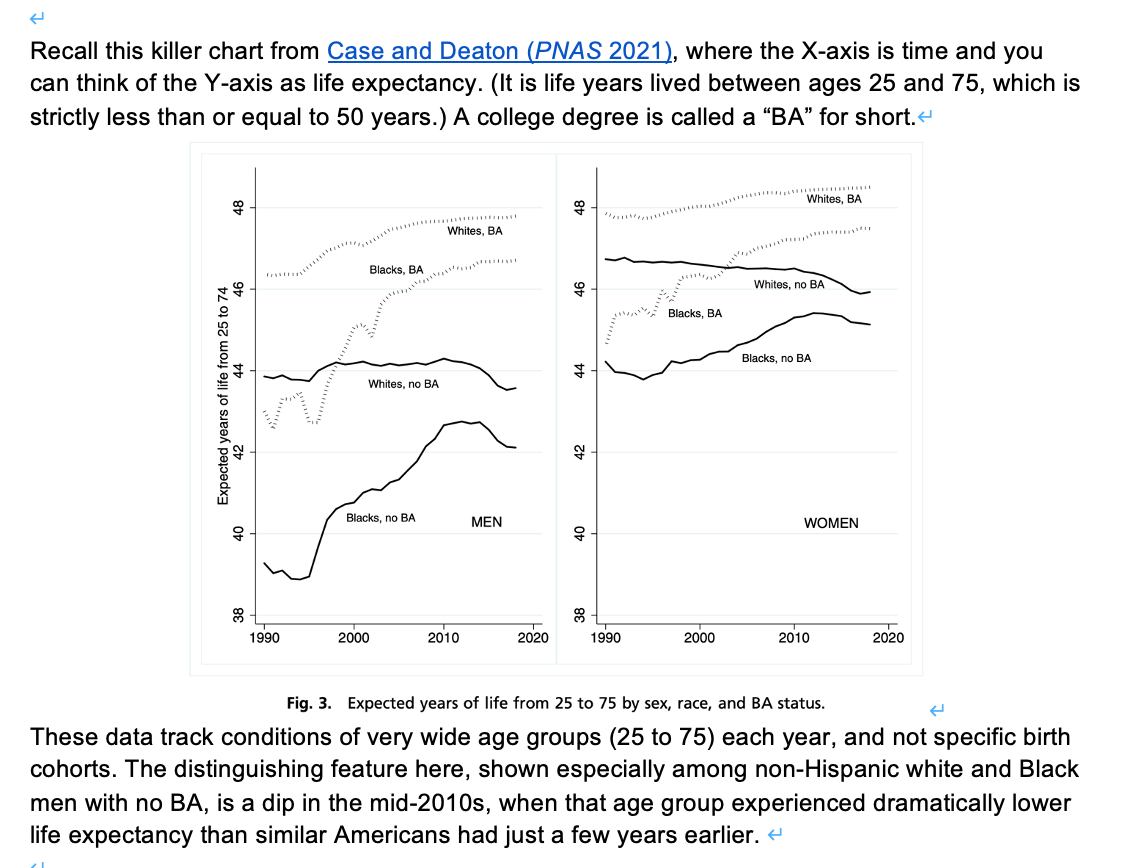

Recall this killer chart from Case and Deaton (PNAS 2021), where the X-axis is time and you can think of the Y-axis as life expectancy. (It is life years lived between ages 25 and 75, which is strictly less than or equal to 50 years.) A college degree is called a BA for short. - Whites, BA Whites, BA Blacks, BA Whites, no BA Blacks, BA Blacks, no BA Whites, no BA Expected years of life from 25 to 74 42 Blacks, no BA MEN WOMEN 40 1990 2000 2010 2020 1990 2000 2010 2020 Fig. 3. Expected years of life from 25 to 75 by sex, race, and BA status. These data track conditions of very wide age groups (25 to 75) each year, and not specific birth cohorts. The distinguishing feature here, shown especially among non-Hispanic white and Black men with no BA, is a dip in the mid-2010s, when that age group experienced dramatically lower life expectancy than similar Americans had just a few years earlier. 4 d) [4 points] Does the allostatic load hypothesis help us understand what we see here? Take a stand, yes or no, and briefly defend your answer. e) [4 points) Is there anything else we have missed? Anything that perhaps Bhattacharya, Hyde, and Tu may have missed because it hadn't been published yet? (Hint: that means the best answer is not in the book.) Take a stand, yes or no, and briefly defend your answer." Recall this killer chart from Case and Deaton (PNAS 2021), where the X-axis is time and you can think of the Y-axis as life expectancy. (It is life years lived between ages 25 and 75, which is strictly less than or equal to 50 years.) A college degree is called a BA for short. - Whites, BA Whites, BA Blacks, BA Whites, no BA Blacks, BA Blacks, no BA Whites, no BA Expected years of life from 25 to 74 42 Blacks, no BA MEN WOMEN 40 1990 2000 2010 2020 1990 2000 2010 2020 Fig. 3. Expected years of life from 25 to 75 by sex, race, and BA status. These data track conditions of very wide age groups (25 to 75) each year, and not specific birth cohorts. The distinguishing feature here, shown especially among non-Hispanic white and Black men with no BA, is a dip in the mid-2010s, when that age group experienced dramatically lower life expectancy than similar Americans had just a few years earlier. 4 d) [4 points] Does the allostatic load hypothesis help us understand what we see here? Take a stand, yes or no, and briefly defend your answer. e) [4 points) Is there anything else we have missed? Anything that perhaps Bhattacharya, Hyde, and Tu may have missed because it hadn't been published yet? (Hint: that means the best answer is not in the book.) Take a stand, yes or no, and briefly defend your


