

Question
Recent geo-political events and the ongoing effects of the Covid-19 pandemic have seen large swings in commodity prices in recent years, particularly in oil
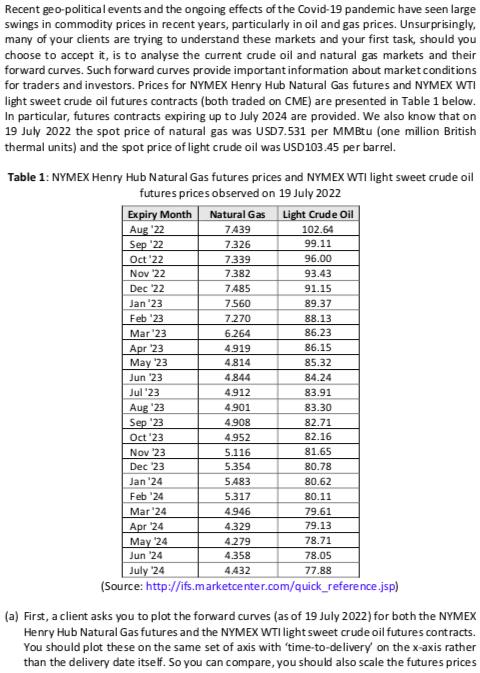
Recent geo-political events and the ongoing effects of the Covid-19 pandemic have seen large swings in commodity prices in recent years, particularly in oil and gas prices. Unsurprisingly, many of your clients are trying to understand these markets and your first task, should you choose to accept it, is to analyse the current crude oil and natural gas markets and their forward curves. Such forward curves provide important information about market conditions for traders and investors. Prices for NYMEX Henry Hub Natural Gas futures and NYMEX WTI light sweet crude oil futures contracts (both traded on CME) are presented in Table 1 below. In particular, futures contracts expiring up to July 2024 are provided. We also know that on 19 July 2022 the spot price of natural gas was USD7.531 per MMBtu (one million British thermal units) and the spot price of light crude oil was USD103.45 per barrel. Table 1: NYMEX Henry Hub Natural Gas futures prices and NYMEX WTI light sweet crude oil futures prices observed on 19 July 2022 Expiry Month Aug '22 Sep 22 Oct 22 Now '22 Dec 22 Jan '23 Feb 23 Mar 23 Apr 23 May 23 Jun 23 Jul '23 Aug '23 Sep 23 Oct '23 Nov 23 Dec 23 Jan '24 Feb '24 Mar 24 Apr 24 May 24 Jun 24 July 24 (Source: Natural Gas 7439 7.326 7.339 7.382 7.485 7.560 7.270 6.264 4.919 4.814 4.844 4.912 4.901 4.908 4.952 5.116 5.354 5.483 5.317 4.946 4.329 4.279 4.358 4.432 Light Crude Oil 102.64 99.11 96.00 93.43 91.15 89.37 88.13 86.23 86.15 85.32 84.24 83.91 83.30 82.71 82.16 81.65 80.78 80.62 80.11 79.61 79.13 78.71 78.05 77.88 http://ifs.marketcenter.com/quick_reference.jsp) (a) First, a client asks you to plot the forward curves (as of 19 July 2022) for both the NYMEX Henry Hub Natural Gas futures and the NYMEX WTI light sweet crude oil futures contracts. You should plot these on the same set of axis with 'time-to-delivery on the x-axis rather than the delivery date itself. So you can compare, you should also scale the futures prices by the current spot price, so that both forward curves start at 100 at time-to-delivery equals zero. For simplicity you should assume that the time-to-delivery is rounded off to the nearest month; e.g. 1 month for Aug 22 contracts, 2 months for Sep '22 contracts.
Step by Step Solution
There are 3 Steps involved in it
Step: 1

Get Instant Access with AI-Powered Solutions
See step-by-step solutions with expert insights and AI powered tools for academic success
Step: 2

Step: 3
Ace Your Homework with AI
Get the answers you need in no time with our AI-driven, step-by-step assistance
Get Started
Income Tax Fundamentals 2013
Authors: Gerald E. Whittenburg, Martha Altus Buller, Steven L Gill
31st Edition
1111972516, 978-1285586618, 1285586611, 978-1285613109, 978-1111972516