Question
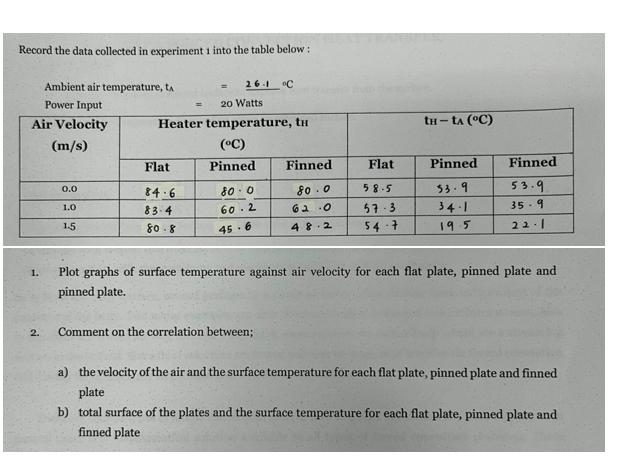
Record the data collected in experiment 1 into the table below: Ambient air temperature, t Power Input Air Velocity (m/s) 1. 2. 0.0 1.0

Record the data collected in experiment 1 into the table below: Ambient air temperature, t Power Input Air Velocity (m/s) 1. 2. 0.0 1.0 1.5 = Flat 84-6 83-4 80-8 26.1 C 20 Watts Heater temperature, ti (C) Pinned 80.0 60.2 45-6 Finned 80.0 62.0 48.2 Comment on the correlation between; Flat 58-5 57-3 54-7 th-tA (C) Pinned 33.9 34-1 19.5 Finned 53.9 35-9 22-1 Plot graphs of surface temperature against air velocity for each flat plate, pinned plate and pinned plate. a) the velocity of the air and the surface temperature for each flat plate, pinned plate and finned plate b) total surface of the plates and the surface temperature for each flat plate, pinned plate and finned plate
Step by Step Solution
There are 3 Steps involved in it
Step: 1

Get Instant Access to Expert-Tailored Solutions
See step-by-step solutions with expert insights and AI powered tools for academic success
Step: 2

Step: 3

Ace Your Homework with AI
Get the answers you need in no time with our AI-driven, step-by-step assistance
Get StartedRecommended Textbook for
Income Tax Fundamentals 2013
Authors: Gerald E. Whittenburg, Martha Altus Buller, Steven L Gill
31st Edition
1111972516, 978-1285586618, 1285586611, 978-1285613109, 978-1111972516
Students also viewed these Chemistry questions
Question
Answered: 1 week ago
Question
Answered: 1 week ago
Question
Answered: 1 week ago
Question
Answered: 1 week ago
Question
Answered: 1 week ago
Question
Answered: 1 week ago
Question
Answered: 1 week ago
Question
Answered: 1 week ago
Question
Answered: 1 week ago
Question
Answered: 1 week ago
Question
Answered: 1 week ago
Question
Answered: 1 week ago
Question
Answered: 1 week ago
Question
Answered: 1 week ago
Question
Answered: 1 week ago
Question
Answered: 1 week ago
Question
Answered: 1 week ago
Question
Answered: 1 week ago
Question
Answered: 1 week ago
View Answer in SolutionInn App


