Answered step by step
Verified Expert Solution
Link Copied!

Question

1 Approved Answer

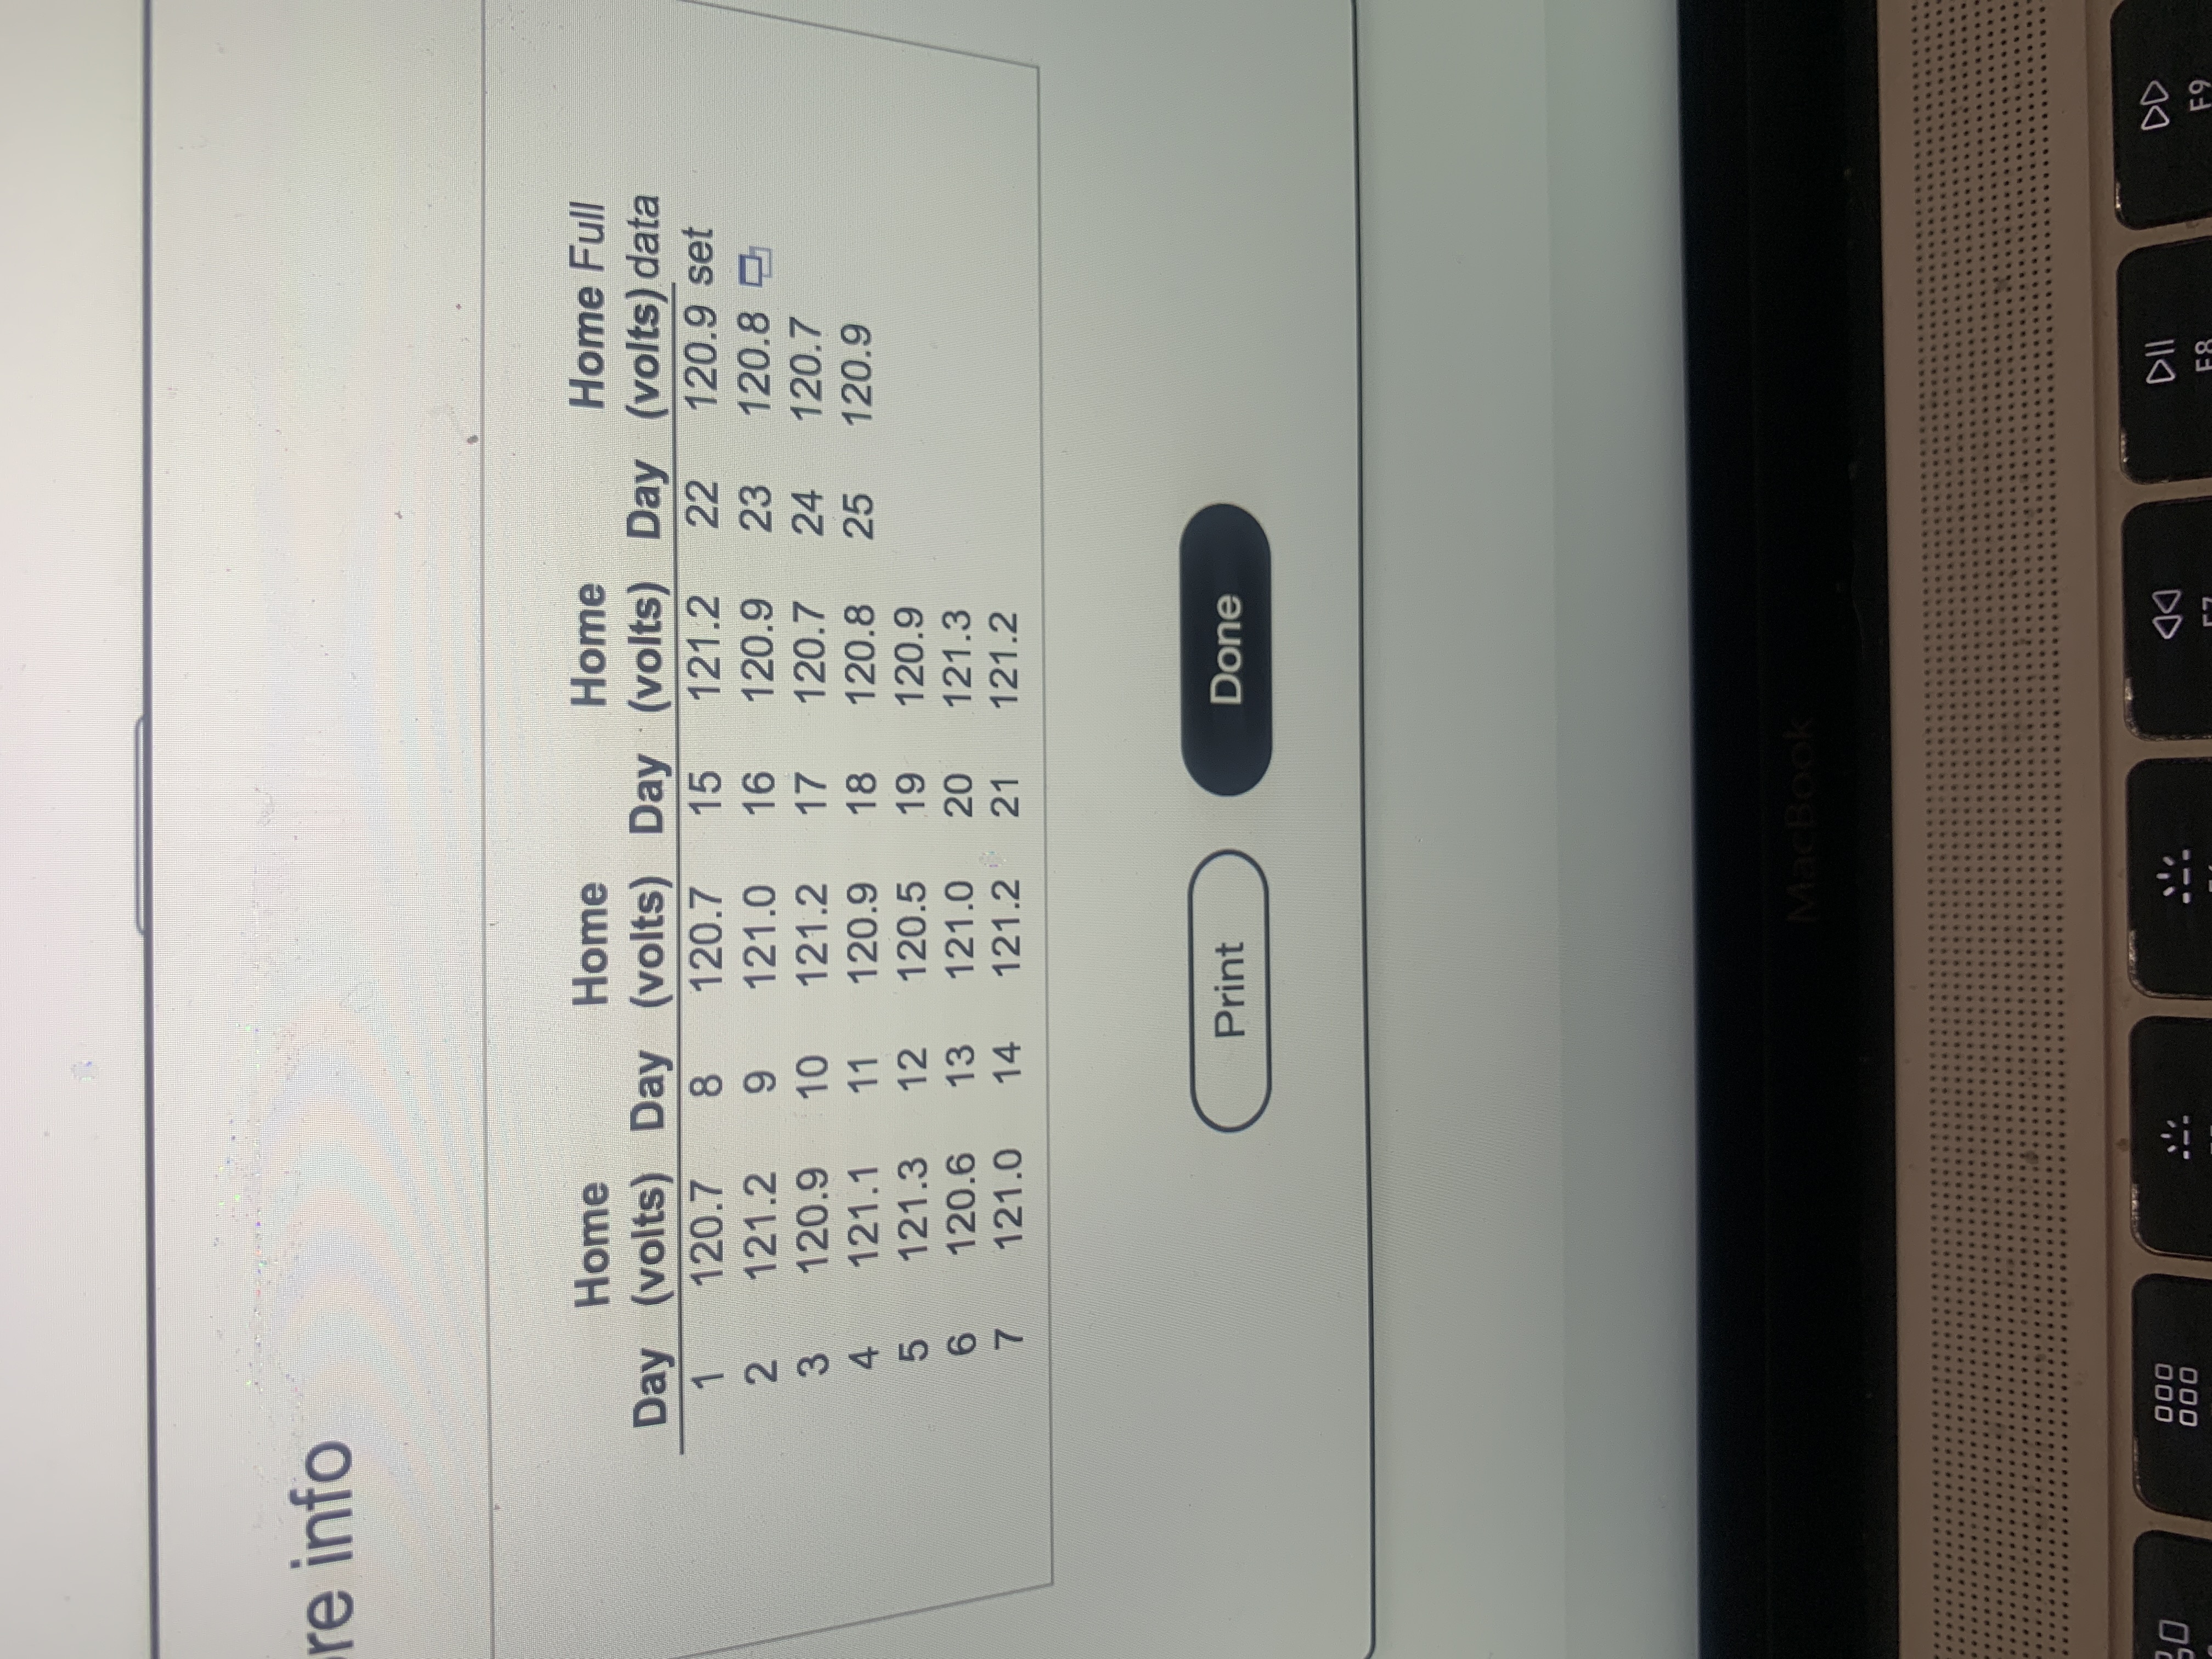
Refer to data set Refer to the accompanying data set and use the 25 home voltage measurements to construct a frequency distribution with five classes.

Refer to data set
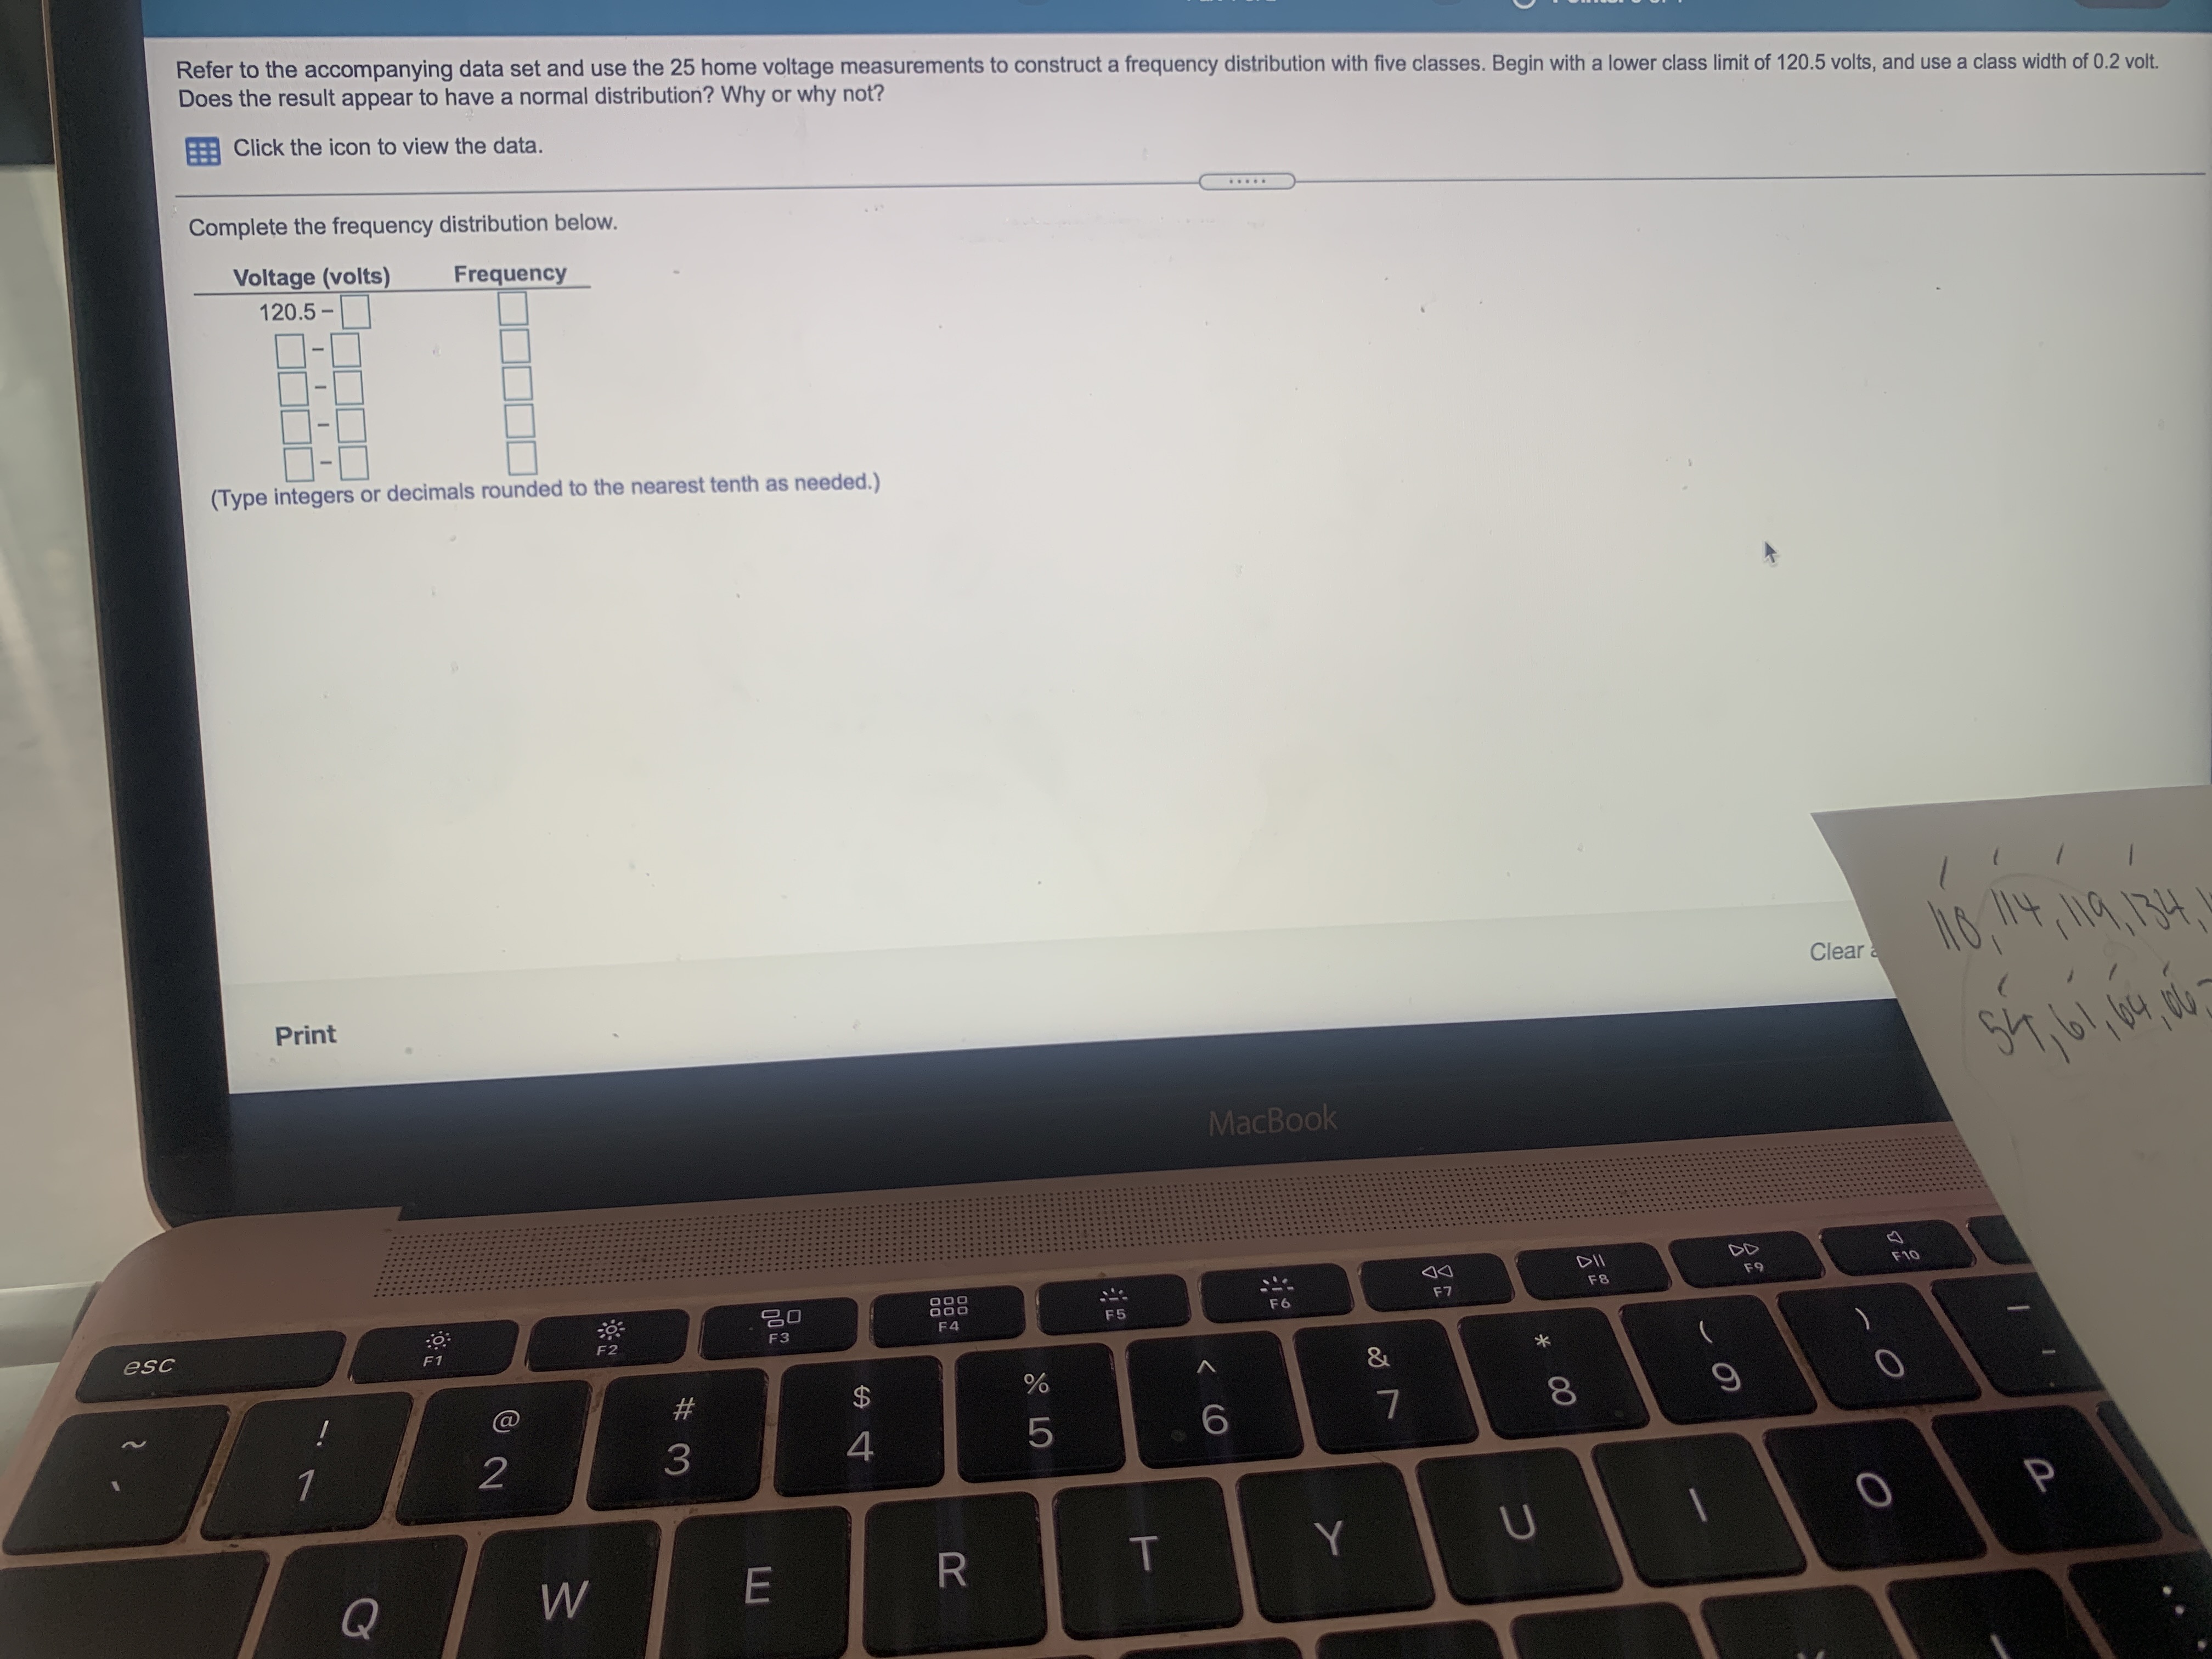
image text in transcribedimage text in transcribed
Refer to the accompanying data set and use the 25 home voltage measurements to construct a frequency distribution with five classes. Begin with a lower class limit of 120.5 volts, and use a class width of 0.2 volt. Does the result appear to have a normal distribution? Why or why not? Click the icon to view the data. Complete the frequency distribution below. Voltage (volts) Frequency 120.5- DOC (Type integers or decimals rounded to the nearest tenth as needed.) 1 Clear 110, 14, 119, 134 Print 54, 61 , 64 , 06 MacBook DD F6 F8 FO 30 N O: esc F3 D % @ O 3 5 6 2 O P T Y U W E Rre info Home Home Home Home Full Day (volts) Day (volts) Day (volts) Day (volts) data 120.7 8 120.7 15 121.2 22 120.9 set 121.2 9 121.0 16 120.9 23 120.8 120.9 10 121.2 17 120.7 24 120.7 VOULAWN 121.1 11 120.9 18 120.8 25 120.9 121.3 12 120.5 19 120.9 120.6 13 121.0 20 121.3 121.0 14 121.2 21 121.2 Print Done MacBook 0 000 DII DD F9

Step by Step Solution

There are 3 Steps involved in it

Step: 1

blur-text-image

Get Instant Access to Expert-Tailored Solutions

See step-by-step solutions with expert insights and AI powered tools for academic success

Step: 2

blur-text-image

Step: 3

blur-text-image

Ace Your Homework with AI

Get the answers you need in no time with our AI-driven, step-by-step assistance

Get Started

Recommended Textbook for

Intermediate Algebra

Authors: Marvin L Bittinger

11th Edition

0321968395, 9780321968395

More Books

Students also viewed these Mathematics questions

Question

3. A theory-based prediction is called a(n) _______________.

Answered: 1 week ago