Refer to Figure 4 in Chapter 4. Analyze the case based on these two graphs and the theory of substitutes and complements. What is your
Refer to Figure 4 in Chapter 4. Analyze the case based on these two graphs and the theory of substitutes and complements.
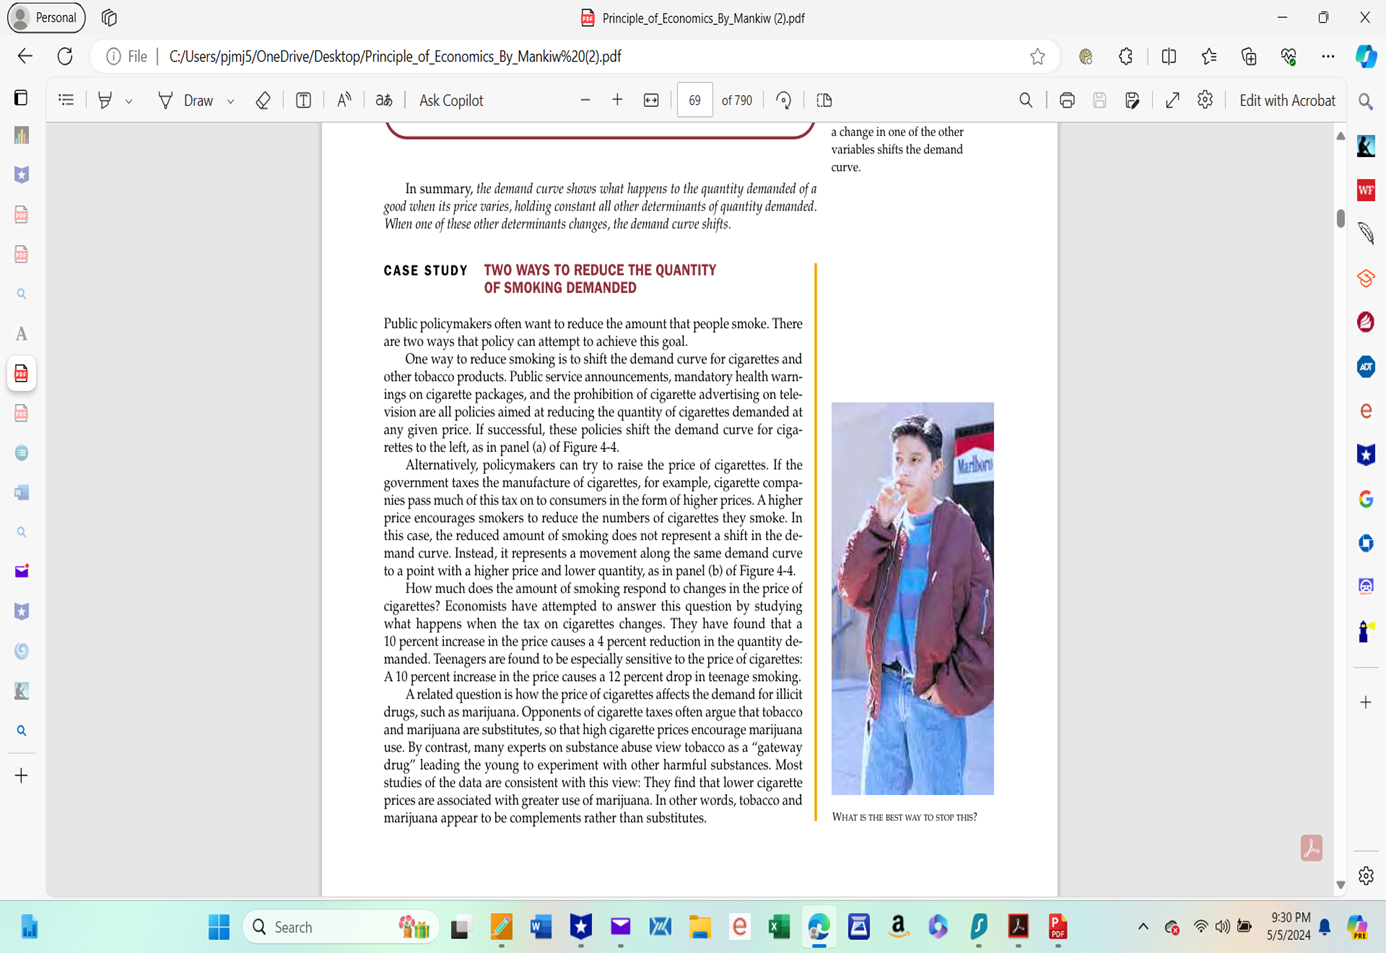
What is your conclusion? Raising taxes on tobacco has any impact on smoking?
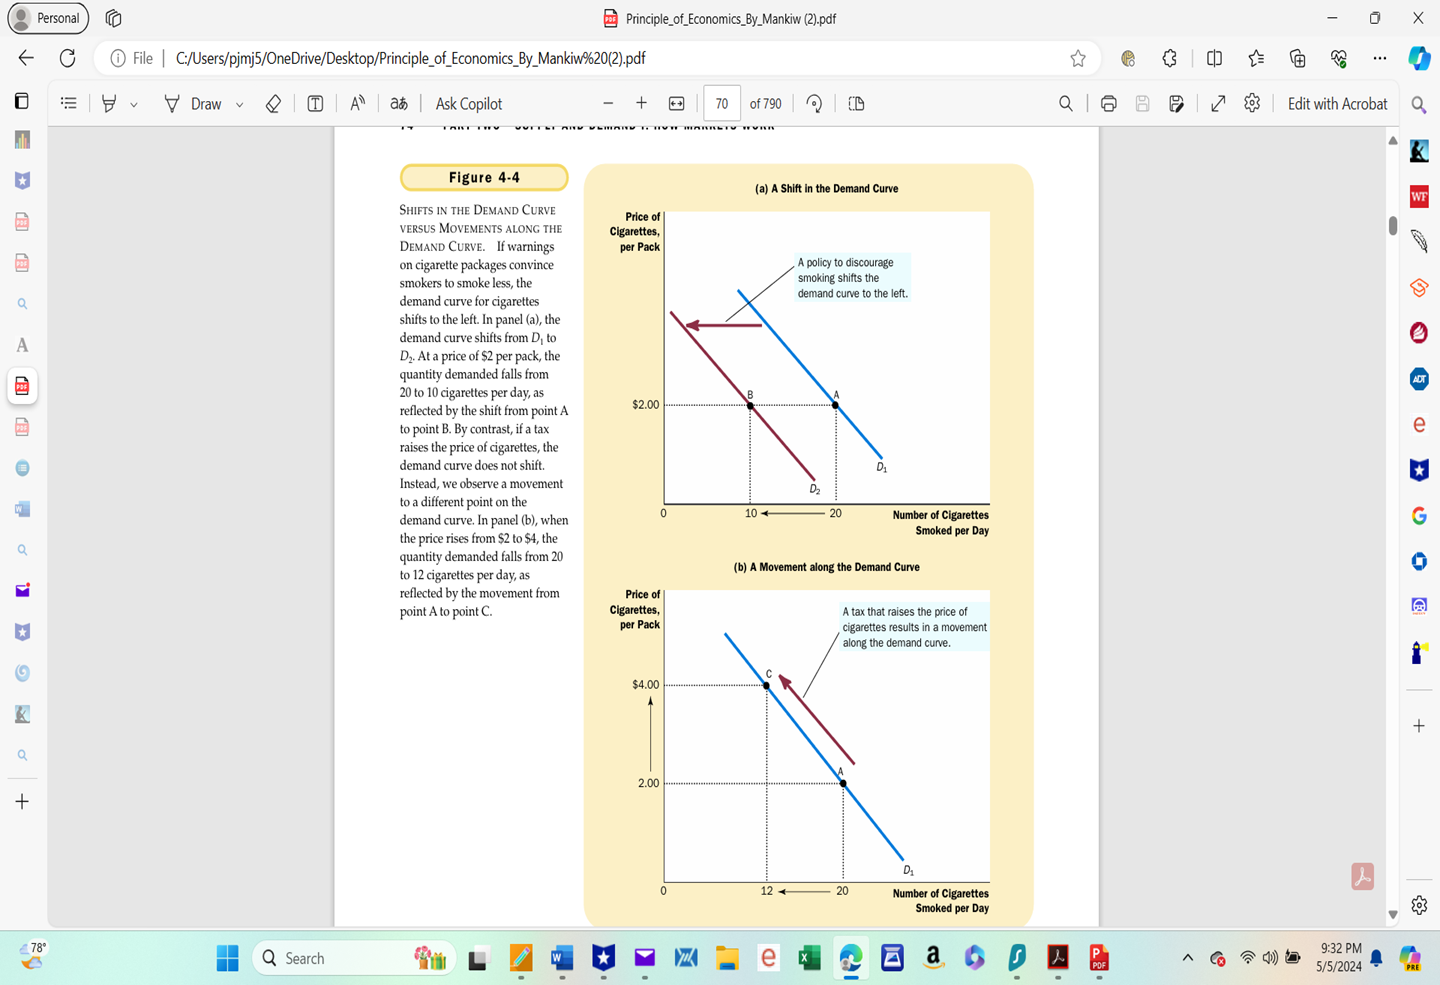
& O m B o B = [1ZH] @ Principle_of_Economics_By_Mankiw (2).pdf (@ (1) File | C/Usersfpjmj5/OneDrive/Desktop/Principle_of Economics_By Mankiwd20(2).pdf v YV Draw -~ O Q Search A ab | AskCopilot - + B || & o0 Q) D w @ G0 @ aQle L J/ a change in one of the ather variables shifts the demand curve. In summary, the demand curve shows what happens to the quantity demanded of a good when its price varies, holding constant all other determinants of quantity demanded. When one of these obher determinants changes, the demand curve shifts. CASE STUDY TWO WAYS TO REDUCE THE QUANTITY OF SMOKING DEMANDED Public policymakers often want to reduce the amount that people smoke. There are two ways that policy can attempt to achieve this goal. One way to reduce smoking is to shift the demand curve for cigarettes and other tabacco products. Public service announcements, mandatory health wam- ings on cigarette packages, and the prohibition of cigarette advertising on tele- vision are all policies aimed at reducing the quantity of cigarettes demanded at any given price. If successful, these policies shift the demand curve for ciga- rettes to the left, as in panel (a) of Figure 4-4. Alternatively, policymakers can try to raise the price of cigarettes. If the government taxes the manufacture of cigarettes, for example, cigarette compa- nies pass much of this tax on to consumers in the form of higher prices. A higher price encourages smokers to reduce the numbers of cigarettes they smoke. In this case, the reduced amount of smoking does not represent a shift in the de- mand curve, Instead, it represents a movement along the same demand curve toa point with a higher price and lower quantity, as in panel (b) of Figure 4-4. How much does the amount of smoking respond to changes in the price of cigarettes? Economists have attempted to answer this question by studying what happens when the tax on cigarettes changes. They have found that a 10 percent increase in the price causes a 4 percent reduction in the quantity de- manded. Teenagers are found to be especially sensitive to the price of cigarettes: A 10 percent increase in the price causes a 12 percent drop in teenage smoking. Arelated question is how the price of cigarettes affects the demand for illicit drugs, such as marijuana. Opponents of cigarette taxes often argue that tobacco and marijuana are substitutes, so that high cigarette prices encourage marijuana use. By contrast, many experts on substance abuse view tobacco as a \"gateway drug\" leading the young to experiment with other harmful substances. Most studies of the data are consistent with this view: They find that lower cigarette prices are associated with greater use of marijuana. In other words, tobacco and marijuana appear to be complements rather than substitutes. Ty w DA Wl c @B WHAT 15 THE BEST WAY TO STOP THIST B | @ @ | Editwith Acrobat A G RS % 9:30 PM 5/5/2024 =] Mo @ x o & #Z E o @ Personal bar Principle_of_Economics_By_Mankiw (2).pdf X C File | C:/Users/pjmj5/OneDrive/Desktop/Principle_of_Economics_By_Mankiw9620(2).pdf ... V Draw & T A at Ask Copilot 70 of 790 Q|6 8 9 / Edit with Acrobat Figure 4-4 (a) A Shift in the Demand Curve SHIFTS IN THE DEMAND CURVE Price of VERSUS MOVEMENTS ALONG THE Cigarettes, DEMAND CURVE. If warnings per Pack on cigarette packages convince A policy to discourage smokers to smoke less, the smoking shifts the demand curve for cigarettes demand curve to the left. shifts to the left. In panel (a), the demand curve shifts from D, to D2. At a price of $2 per pack, the quantity demanded falls from 20 to 10 cigarettes per day, as reflected by the shift from point A $2.00 -. to point B. By contrast, if a tax raises the price of cigarettes, the demand curve does not shift. Instead, we observe a movement to a different point on the 10- - 20 demand curve. In panel (b), when Number of Cigarettes the price rises from $2 to $4, the Smoked per Day quantity demanded falls from 20 o 12 cigarettes per day, as (b) A Movement along the Demand Curve reflected by the movement from Price of point A to point C. Cigarettes, A tax that raises the price of per Pack cigarettes results in a movement along the demand curve. G $4.00 - + 2.00- + 12 - 20 Number of Cigarettes Smoked per Day 78 Q Search 9:32 PM 5/5/2024
Step by Step Solution
There are 3 Steps involved in it
Step: 1
Get Instant Access to Expert-Tailored Solutions
See step-by-step solutions with expert insights and AI powered tools for academic success
Step: 2
Step: 3
Ace Your Homework with AI
Get the answers you need in no time with our AI-driven, step-by-step assistance