Answered step by step
Verified Expert Solution
Link Copied!

Question

1 Approved Answer

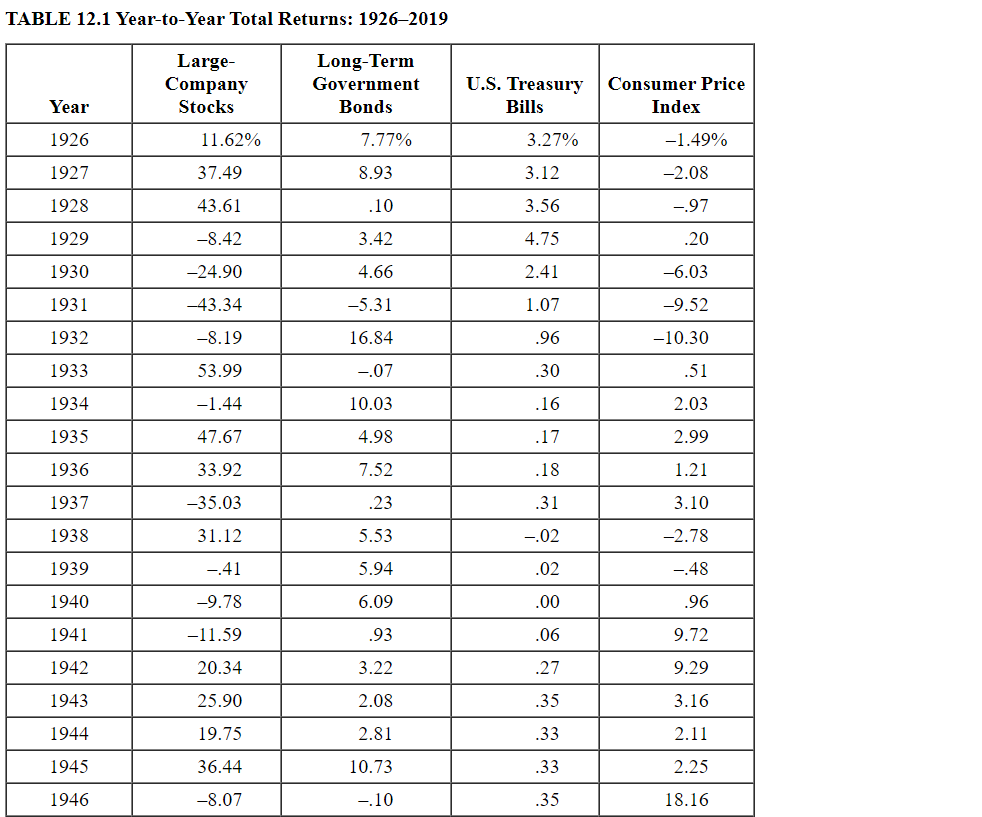
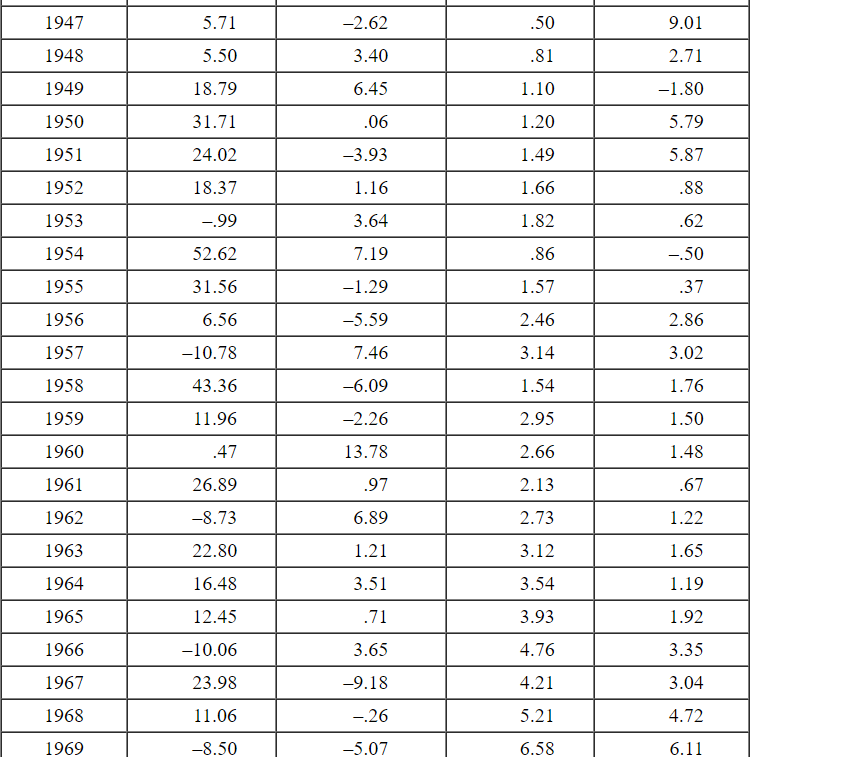
Refer to Table 12.1 and look at the period from 1970 through 1975. a. Calculate the arithmetic average returns for large-company stocks and T-bills over
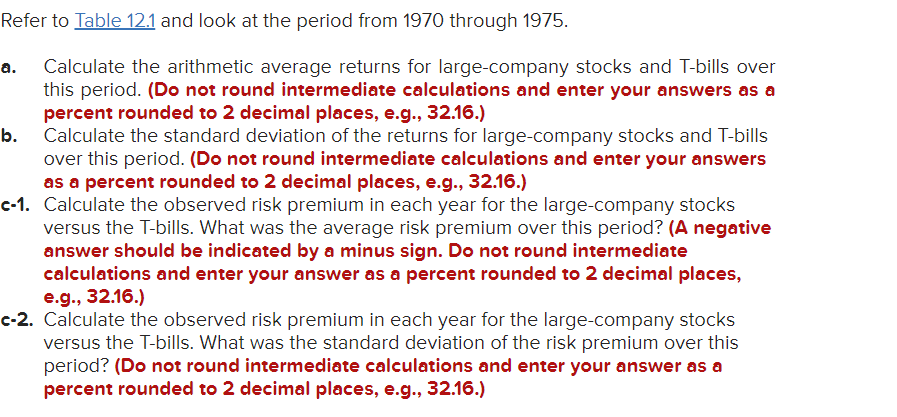
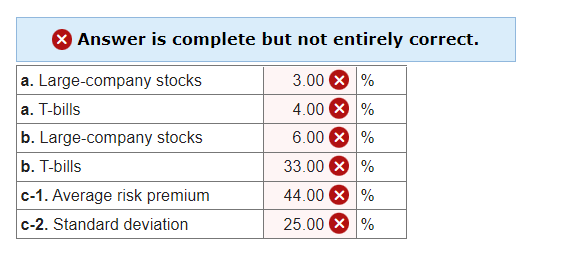
image text in transcribedimage text in transcribedimage text in transcribedimage text in transcribedimage text in transcribedimage text in transcribed

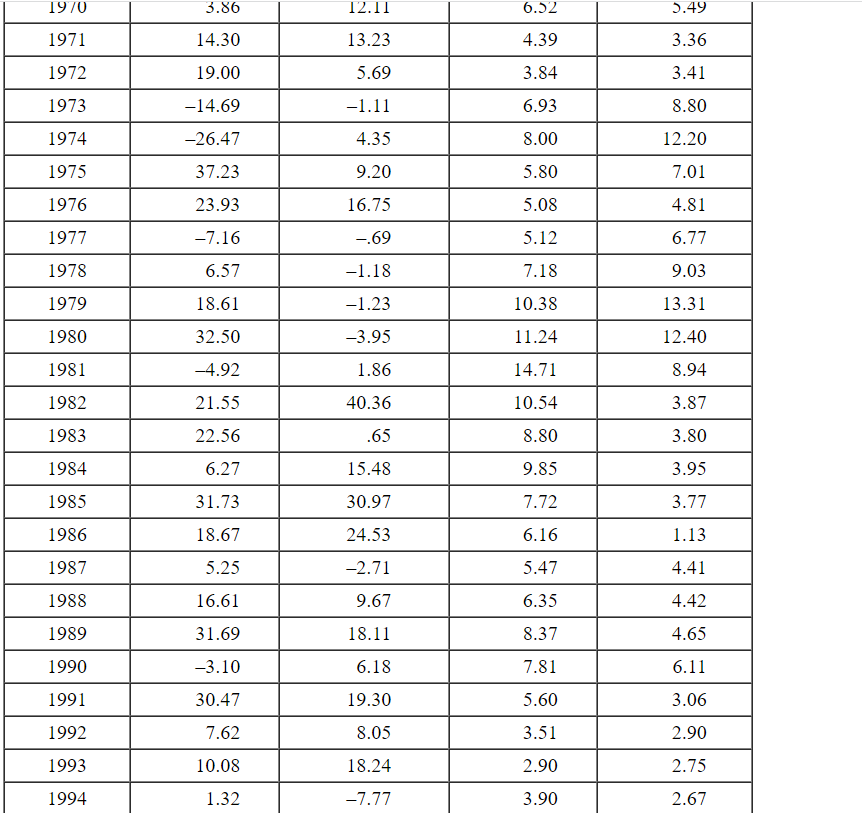
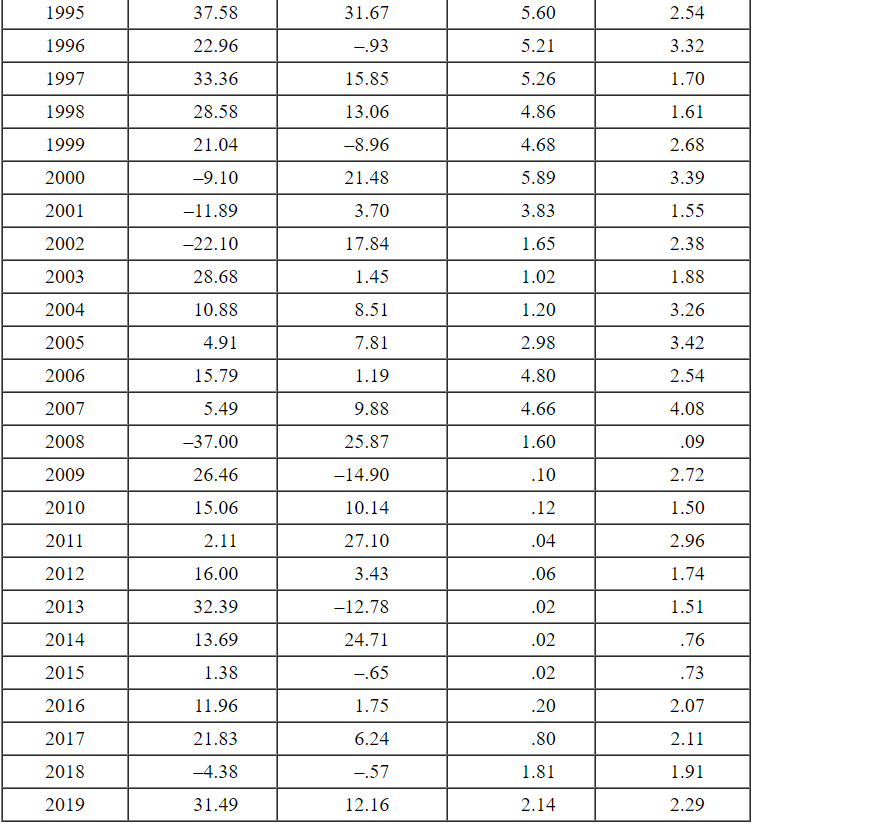
Refer to Table 12.1 and look at the period from 1970 through 1975. a. Calculate the arithmetic average returns for large-company stocks and T-bills over this period. (Do not round intermediate calculations and enter your answers as a percent rounded to 2 decimal places, e.g., 32.16.) b. Calculate the standard deviation of the returns for large-company stocks and T-bills over this period. (Do not round intermediate calculations and enter your answers as a percent rounded to 2 decimal places, e.g., 32.16.) c-1. Calculate the observed risk premium in each year for the large-company stocks versus the T-bills. What was the average risk premium over this period? (A negative answer should be indicated by a minus sign. Do not round intermediate calculations and enter your answer as a percent rounded to 2 decimal places, e.g., 32.16.) c-2. Calculate the observed risk premium in each year for the large-company stocks versus the T-bills. What was the standard deviation of the risk premium over this period? (Do not round intermediate calculations and enter your answer as a percent rounded to 2 decimal places, e.g., 32.16.) Answer is complete but not entirely correct. a. Large-company stocks a. T-bills b. Large-company stocks b. T-bills c-1. Average risk premium c-2. Standard deviation 3.00 % 4.00 X % 6.00 X % 33.00 % 44.00 X % 25.00 X % TABLE 12.1 Year-to-Year Total Returns: 19262019 Large- Company Stocks Long-Term Government Bonds U.S. Treasury Bills Consumer Price Index Year 1926 11.62% 7.77% 3.27% -1.49% 1927 37.49 8.93 3.12 -2.08 1928 43.61 .10 3.56 -97 1929 -8.42 3.42 4.75 .20 1930 -24.90 4.66 2.41 -6.03 1931 -43.34 1.07 -9.52 -5.31 16.84 1932 -8.19 .96 -10.30 1933 53.99 -07 .30 .51 1934 -1.44 10.03 .16 2.03 1935 47.67 4.98 .17 2.99 1936 33.92 7.52 .18 1.21 1937 -35.03 .23 .31 3.10 1938 31.12 5.53 -02 -2.78 1939 -41 5.94 .02 -.48 1940 -9.78 6.09 .00 .96 1941 -11.59 .93 .06 9.72 1942 20.34 3.22 .27 9.29 1943 25.90 2.08 .35 3.16 1944 19.75 2.81 .33 2.11 1945 36.44 10.73 .33 2.25 1946 -8.07 -.10 .35 18.16 1947 5.71 -2.62 .50 9.01 1948 5.50 3.40 .81 2.71 1949 18.79 6.45 1.10 -1.80 1950 31.71 .06 1.20 5.79 1951 24.02 -3.93 1.49 5.87 1952 18.37 1.16 1.66 .88 1953 -.99 3.64 1.82 .62 1954 52.62 7.19 .86 -.50 1955 31.56 -1.29 1.57 .37 1956 6.56 -5.59 2.46 2.86 1957 -10.78 7.46 3.14 3.02 1958 43.36 -6.09 1.54 1.76 1959 11.96 -2.26 2.95 1.50 1960 .47 13.78 2.66 1.48 1961 26.89 .97 2.13 .67 1962 -8.73 6.89 2.73 1.22 1963 22.80 1.21 3.12 1.65 1964 16.48 3.51 3.54 1.19 1965 12.45 .71 3.93 1.92 1966 -10.06 3.65 4.76 3.35 1967 23.98 -9.18 4.21 3.04 1968 11.06 -.26 5.21 4.72 1969 -8.50 -5.07 6.58 6.11 1970 3.86 12.11 6.32 5.49 1971 14.30 13.23 4.39 3.36 1972 19.00 5.69 3.84 3.41 1973 -14.69 -1.11 6.93 8.80 1974 -26.47 4.35 8.00 12.20 1975 37.23 9.20 5.80 7.01 1976 23.93 16.75 5.08 4.81 1977 -7.16 -.69 5.12 6.77 1978 6.57 -1.18 7.18 9.03 1979 18.61 -1.23 10.38 13.31 1980 32.50 -3.95 11.24 12.40 1981 -4.92 1.86 14.71 8.94 1982 21.55 40.36 10.54 3.87 1983 22.56 .65 8.80 3.80 1984 6.27 15.48 9.85 3.95 1985 31.73 30.97 7.72 3.77 1986 18.67 24.53 6.16 1.13 1987 5.25 -2.71 5.47 4.41 1988 16.61 9.67 6.35 4.42 1989 31.69 18.11 8.37 4.65 1990 -3.10 6.18 7.81 6.11 1991 30.47 19.30 5.60 3.06 1992 7.62 8.05 3.51 2.90 1993 10.08 18.24 2.90 2.75 1994 1.32 -7.77 3.90 2.67 1995 37.58 31.67 5.60 2.54 1996 22.96 -93 5.21 3.32 1997 33.36 15.85 5.26 1.70 1998 28.58 13.06 4.86 1.61 1999 21.04 -8.96 4.68 2.68 2000 -9.10 21.48 5.89 3.39 2001 -11.89 3.70 3.83 1.55 2002 -22.10 17.84 1.65 2.38 2003 28.68 1.45 1.02 1.88 2004 10.88 8.51 1.20 3.26 2005 4.91 7.81 2.98 3.42 2006 15.79 1.19 4.80 2.54 2007 5.49 9.88 4.66 4.08 2008 -37.00 25.87 1.60 .09 2009 26.46 -14.90 .10 2.72 2010 15.06 10.14 .12 1.50 2011 2.11 27.10 .04 2.96 2012 16.00 3.43 .06 1.74 2013 32.39 -12.78 .02 1.51 2014 13.69 24.71 .02 .76 2015 1.38 -.65 .02 .73 2016 11.96 1.75 .20 2.07 2017 21.83 6.24 .80 2.11 2018 -4.38 -.57 1.81 1.91 2019 31.49 12.16 2.14 2.29
Step by Step Solution

There are 3 Steps involved in it

Step: 1

blur-text-image

Get Instant Access to Expert-Tailored Solutions

See step-by-step solutions with expert insights and AI powered tools for academic success

Step: 2

blur-text-image_2

Step: 3

blur-text-image_3

Ace Your Homework with AI

Get the answers you need in no time with our AI-driven, step-by-step assistance

Get Started

Recommended Textbook for

Enterprise Applications And Services In The Finance Industry

Authors: Artur Lugmayr

1st Edition

331928150X,3319281518

More Books

Students also viewed these Finance questions

Question

5. How do people enact cultural membership through communication?

Answered: 1 week ago