

Answered step by step
Verified Expert Solution
Question
1 Approved Answer
Refer to Table S 6 . 1 - Factors for Computing Control Chart Limits ( 3 sigma ) for this problem. Twelve samples, each containing
Refer to Table S Factors for Computing Control Chart Limits sigma for this problem.
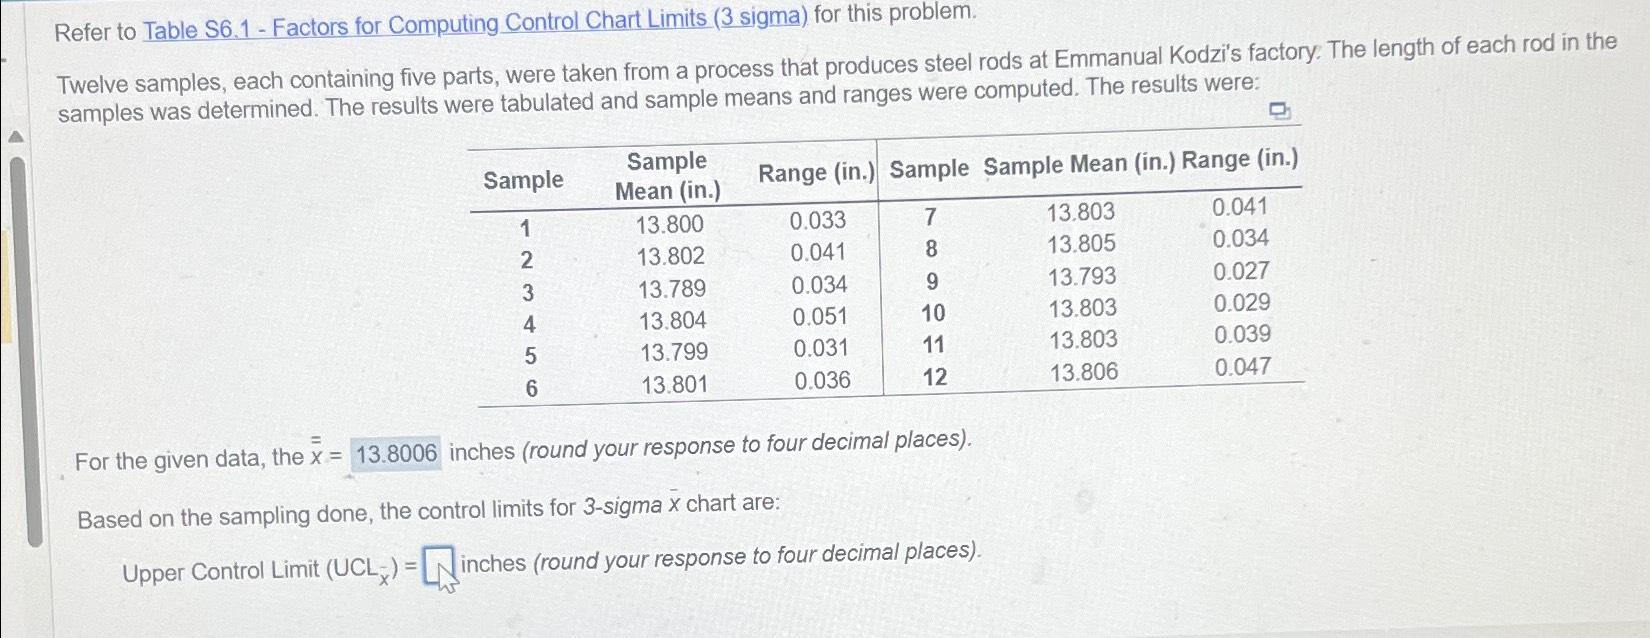
Twelve samples, each containing five parts, were taken from a process that produces steel rods at Emmanual Kodzi's factory. The length of each rod in the samples was determined. The results were tabulated and sample means and ranges were computed. The results were:
tableSampletableSampleMean inRange inSample Sample Mean in Range in
For the given data, the inches round your response to four decimal places
Based on the sampling done, the control limits for sigma chart are:
Upper Control Limit inches round your response to four decimal places
Step by Step Solution
There are 3 Steps involved in it
Step: 1

Get Instant Access to Expert-Tailored Solutions
See step-by-step solutions with expert insights and AI powered tools for academic success
Step: 2

Step: 3
Ace Your Homework with AI
Get the answers you need in no time with our AI-driven, step-by-step assistance
Get Started
Quantitative Methods For Business
Authors: David Anderson, Dennis Sweeney, Thomas Williams, Jeffrey Cam
11th Edition
978-0324651812, 324651813, 978-0324651751