

Question
Refer to the accompanying scatterplot. a. Examine the pattern of all10 points and subjectively determine whether there appears to be a strong correlation between x
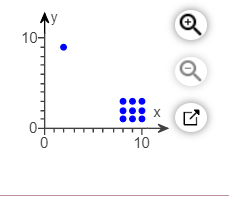
Refer to the accompanying scatterplot.
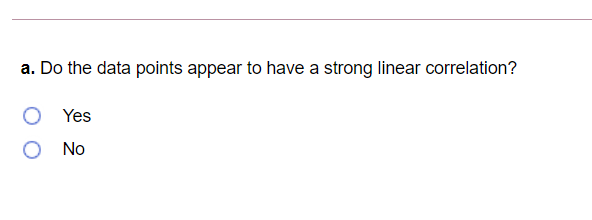
a. Examine the pattern of all10 points and subjectively determine whether there appears to be a strong correlation between x and y.
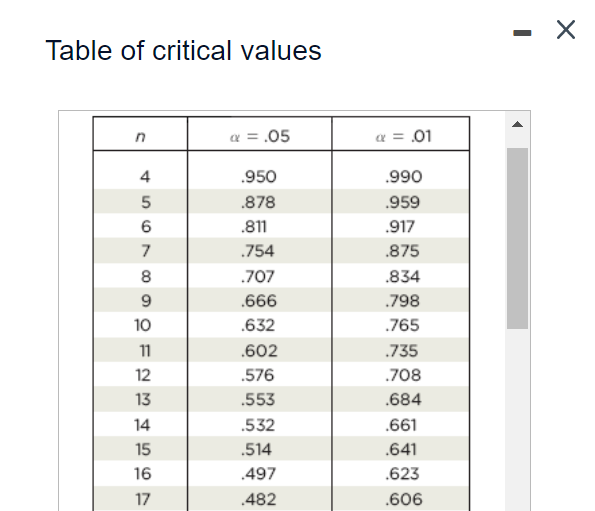
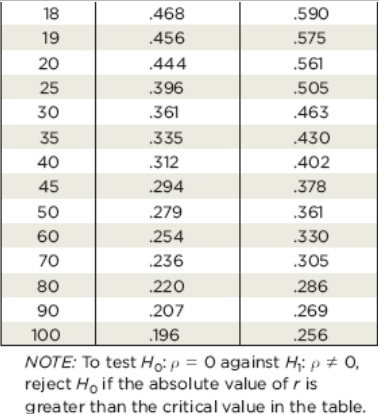
b. Find the value of the correlation coefficient r and determine whether there is a linear correlation.
c. Remove the point with coordinates(2,9) and find the correlation coefficient r and determine whether there is a linear correlation.
d. What do you conclude about the possible effect from a single pair ofvalues?
Step by Step Solution
There are 3 Steps involved in it
Step: 1

Get Instant Access to Expert-Tailored Solutions
See step-by-step solutions with expert insights and AI powered tools for academic success
Step: 2

Step: 3
Ace Your Homework with AI
Get the answers you need in no time with our AI-driven, step-by-step assistance
Get Started
First Course In Mathematical Logic
Authors: Patrick Suppes, Shirley Hill
1st Edition
0486150941, 9780486150949