Question
Refer to the figure. Price (dollars) 10 9 8 2 1 O Market for Artichokes 50 100 D 150 S 200 Quantity (pounds of


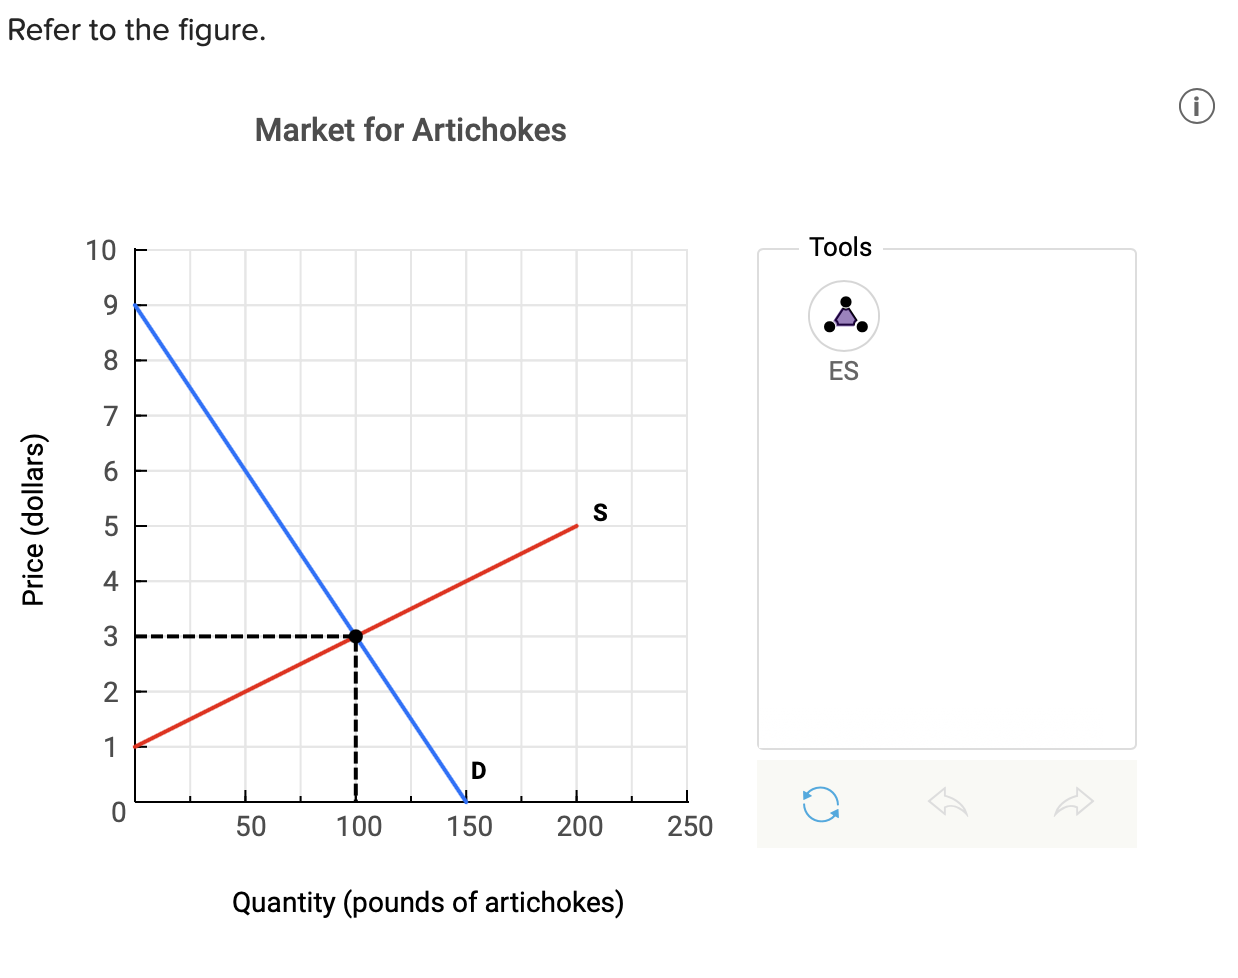
Refer to the figure. Price (dollars) 10 9 8 2 1 O Market for Artichokes 50 100 D 150 S 200 Quantity (pounds of artichokes) 250 Tools .. ES The graph represents the market for artichokes (in pounds per week) at a Midwest farmers' market. Suppose the equilibrium price of artichokes is $3 per pound and the equilibrium quantity is 100 pounds of artichokes per week. Using the graph determine how much economic surplus is generated in the market each week. Economic surplus: $
Step by Step Solution
3.55 Rating (155 Votes )
There are 3 Steps involved in it
Step: 1
Economic Surplus Economic surplus consumer surplus produ...
Get Instant Access to Expert-Tailored Solutions
See step-by-step solutions with expert insights and AI powered tools for academic success
Step: 2

Step: 3

Ace Your Homework with AI
Get the answers you need in no time with our AI-driven, step-by-step assistance
Get StartedRecommended Textbook for
Managerial Economics
Authors: Paul Keat, Philip K Young, Steve Erfle
7th edition
0133020266, 978-0133020267
Students also viewed these Economics questions
Question
Answered: 1 week ago
Question
Answered: 1 week ago
Question
Answered: 1 week ago
Question
Answered: 1 week ago
Question
Answered: 1 week ago
Question
Answered: 1 week ago
Question
Answered: 1 week ago
Question
Answered: 1 week ago
Question
Answered: 1 week ago
Question
Answered: 1 week ago
Question
Answered: 1 week ago
Question
Answered: 1 week ago
Question
Answered: 1 week ago
Question
Answered: 1 week ago
Question
Answered: 1 week ago
Question
Answered: 1 week ago
Question
Answered: 1 week ago
Question
Answered: 1 week ago
Question
Answered: 1 week ago
Question
Answered: 1 week ago
Question
Answered: 1 week ago
Question
Answered: 1 week ago
Question
Answered: 1 week ago
View Answer in SolutionInn App


