Question
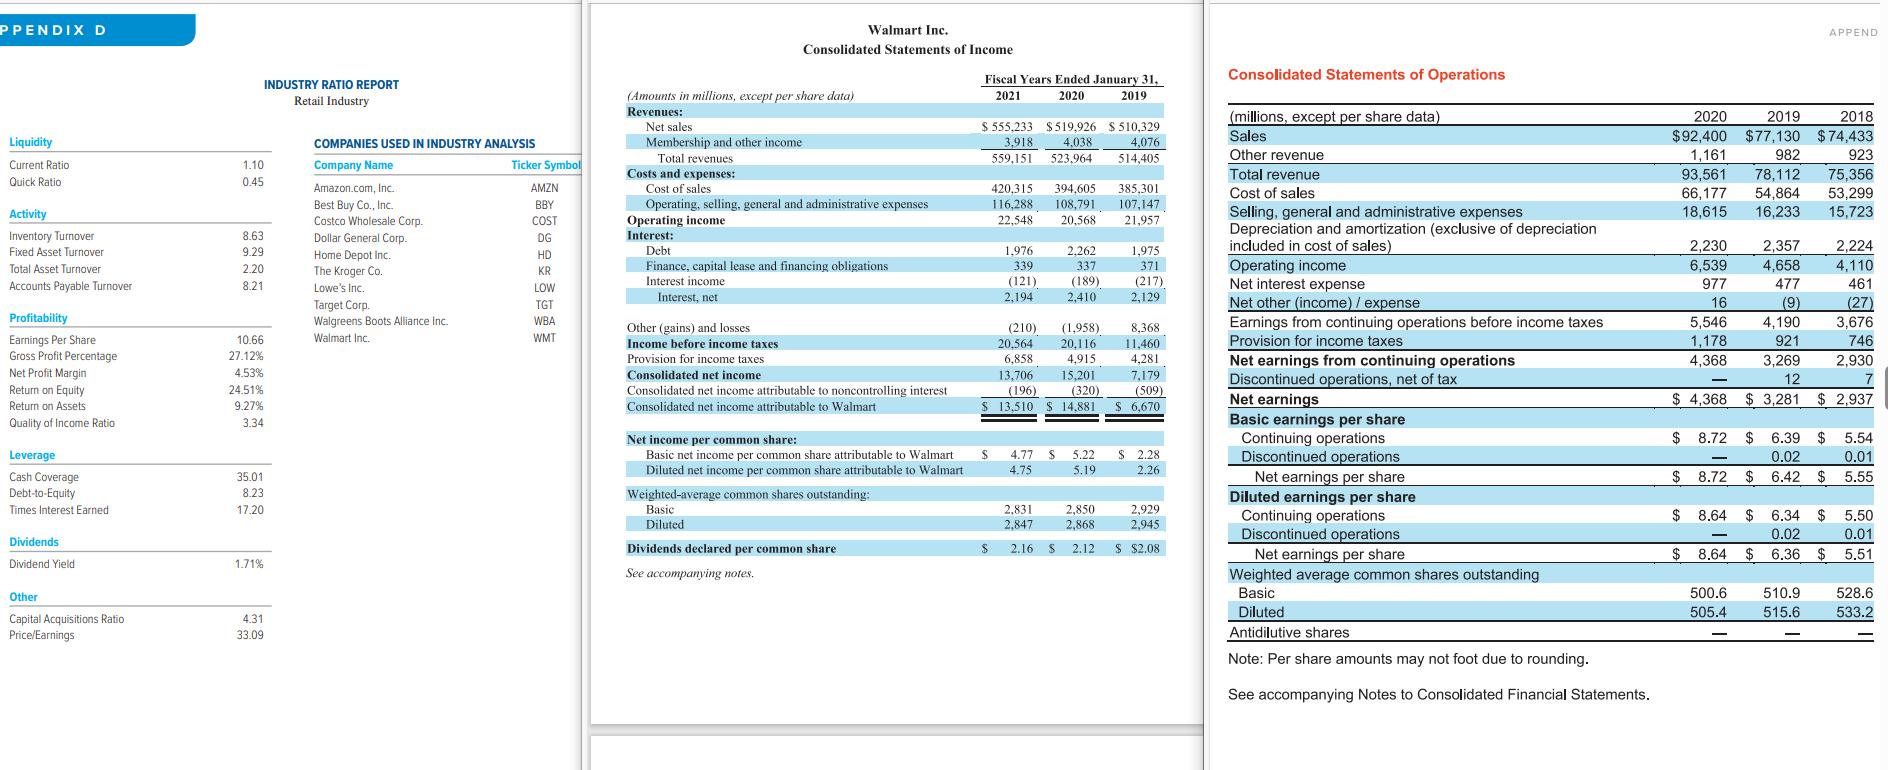
Refer to the following: Target Corporation in Appendix B,Walmart Incorporated in Appendix C,and the Industry Ratio Report in Appendix D.] Required: 1.Compute the total asset
Refer to the following: Target Corporation in Appendix B, Walmart Incorporated in Appendix C, and the Industry Ratio Report in Appendix D.]
Required:
1. Compute the total asset turnover ratio on total operating revenues for both companies.
2. Compared to each other, is the management of these two companies more or less effective at utilizing assets to generate sales?
3. How does each company’s management compare to the industry regarding the total asset turnover ratio?
4. If both companies failed to record the adjusting entry for depreciation expense for the most recent year, what impact will that have on the total asset turnover ratio?
5-a. For each company, calculate the percentage change from fiscal year ended in 2020 to the fiscal year ended in 2021 for each of the following accounts, rounded to two decimal places.
5-b.Which company’s management was more effective at controlling costs between fiscal years ended 2020 and 2021?

PPENDIX D Liquidity Current Ratio Quick Ratiol Activity Inventory Turnover Fixed Asset Turnover Total Asset Turnover Accounts Payable Turnover Profitability Earnings Per Share Gross Profit Percentage: Net Profit Margin Return on Equity Return on Assets Quality of Income Ratio Leverage Cash Coverage Debt-to-Equity Times Interest Earned Dividends Dividend Yield Other Capital Acquisitions Ratio Price/Earnings 1.10 0.45 8.63 9.29 2.20 8.21 10.66 27.12% 4.53% 24.51% 9.27% INDUSTRY RATIO REPORT Retail Industry 3.34 35.01 8.23 17.20 1.71% 4.31 33.09 COMPANIES USED IN INDUSTRY ANALYSIS Company Name Amazon.com, Inc. Best Buy Co., Inc. Costco Wholesale Corp. Dollar General Corp. Home Depot Inc. The Kroger Co. Lowe's Inc. Target Corp. Walgreens Boots Alliance Inc. Walmart Inc. Ticker Symbol AMZN BBY COST DG HD KR LOW TGT WBA WMT Walmart Inc. Consolidated Statements of Income (Amounts in millions, except per share data) Revenues: Net sales Membership and other income Total revenues Costs and expenses: Cost of sales Operating, selling, general and administrative expenses Operating income Interest: Debt Finance, capital lease and financing obligations Interest income Interest, net Other (gains) and losses Income before income taxes Provision for income taxes. Consolidated net income Consolidated net income attributable to noncontrolling interest Consolidated net income attributable to Walmart Net income per common share: Basic net income per common share attributable to Walmart Diluted net income per common share attributable to Walmart Weighted-average common shares outstanding: Basic Diluted Dividends declared per common share See accompanying notes. Fiscal Years Ended January 31, 2021 2020 2019 $555,233 $519,926 $510,329 3,918 4,076 4,038 559,151 523,964 514.405 $ S 420,315 394,605 385,301 116,288 108,791 107,147 22,548 20,568 21,957 1.976 339 (121) 2,194 2.262 337 (189) 2,410 (210) (1,958) 20,564 20,116 6,858 4,915 13,706 15,201 (196) (320) 14.881 13,510 2,831 2,847 4.77 $ 5.22 4.75 5.19 1,975 371 (217) 2,129 8,368 11,460 4,281 7,179 (509) $ 6,670 $ 2.28 2.26 2,850 2,929 2,868 2,945 2.16 S 2.12 $ $2.08 Consolidated Statements of Operations (millions, except per share data) Sales Other revenue Total revenue Cost of sales Selling, general and administrative expenses Depreciation and amortization (exclusive of depreciation included in cost of sales) Operating income Net interest expense Net other (income) / expense Earnings from continuing operations before income taxes Provision for income taxes Net earnings from continuing operations Discontinued operations, net of tax Net earnings Basic earnings per share Continuing operations Discontinued operations Net earnings per share Diluted earnings per share Continuing operations Discontinued operations Net earnings per share Weighted average common shares outstanding Basic Diluted Antidilutive shares Note: Per share amounts may not foot due to rounding. See accompanying Notes to Consolidated Financial Statements. 2020 2019 2018 $92,400 $77,130 $74,433 1,161 982 923 93,561 78,112 75,356 66,177 54,864 53,299 18,615 16,233 15,723 $4,368 2,224 2.230 6,539 2,357 4,658 477 (9) 4,110 461 977 16 (27) 5,546 4,190 3,676 1,178 921 746 4,368 3,269 2,930 12 7 $3,281 $ 2,937 $ APPEND $ 8.72 $ 6.39 $ 5.54 0.02 0.01 8.72 $ 6.42 $5.55 $ 8.64 $6.34 $ 5.50 0.02 0.01 $ 8.64 $6.36 $ 5.51 500.6 505.4 510.9 528.6 515.6 533.2
Step by Step Solution
3.35 Rating (155 Votes )
There are 3 Steps involved in it
Step: 1
The question youve presented requires an analysis of financial statements for two companies Target Corporation and Walmart Incorporated as well as a comparison to the industry ratio report To address ...
Get Instant Access to Expert-Tailored Solutions
See step-by-step solutions with expert insights and AI powered tools for academic success
Step: 2

Step: 3

Ace Your Homework with AI
Get the answers you need in no time with our AI-driven, step-by-step assistance
Get Started


