Question
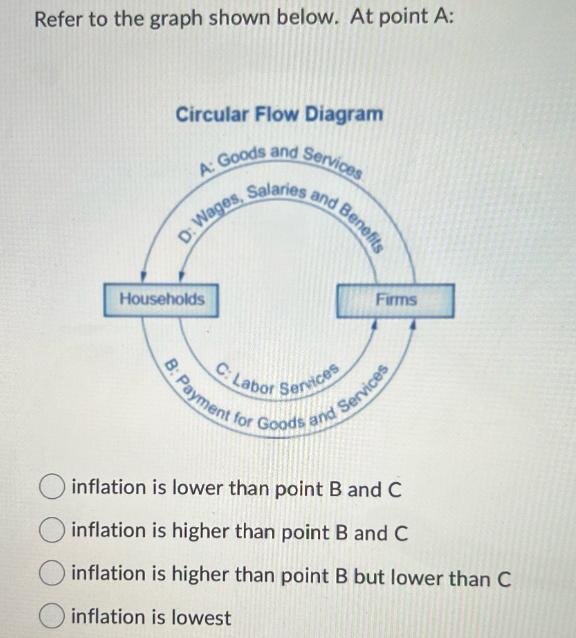
Refer to the graph shown below. At point A: Circular Flow Diagram A: Goods and Services D: Wages, Households Salaries and Benefits Firms B:

Refer to the graph shown below. At point A: Circular Flow Diagram A: Goods and Services D: Wages, Households Salaries and Benefits Firms B: Payment for Goods and Services C: Labor Services inflation is lower than point B and C inflation is higher than point B and C inflation is higher than point B but lower than C inflation is lowest
Step by Step Solution
There are 3 Steps involved in it
Step: 1
The detailed answer for the above question is provided below ANSWER Based on the circular flow diagram you provided I can answer your questions about ...
Get Instant Access to Expert-Tailored Solutions
See step-by-step solutions with expert insights and AI powered tools for academic success
Step: 2

Step: 3

Ace Your Homework with AI
Get the answers you need in no time with our AI-driven, step-by-step assistance
Get StartedRecommended Textbook for
Principles Of Economics
Authors: OpenStax
2nd Edition
1506699863, 978-1506699868
Students also viewed these Economics questions
Question
Answered: 1 week ago
Question
Answered: 1 week ago
Question
Answered: 1 week ago
Question
Answered: 1 week ago
Question
Answered: 1 week ago
Question
Answered: 1 week ago
Question
Answered: 1 week ago
Question
Answered: 1 week ago
Question
Answered: 1 week ago
Question
Answered: 1 week ago
Question
Answered: 1 week ago
Question
Answered: 1 week ago
Question
Answered: 1 week ago
Question
Answered: 1 week ago
Question
Answered: 1 week ago
Question
Answered: 1 week ago
Question
Answered: 1 week ago
Question
Answered: 1 week ago
Question
Answered: 1 week ago
Question
Answered: 1 week ago
Question
Answered: 1 week ago
Question
Answered: 1 week ago
Question
Answered: 1 week ago
View Answer in SolutionInn App


