Question
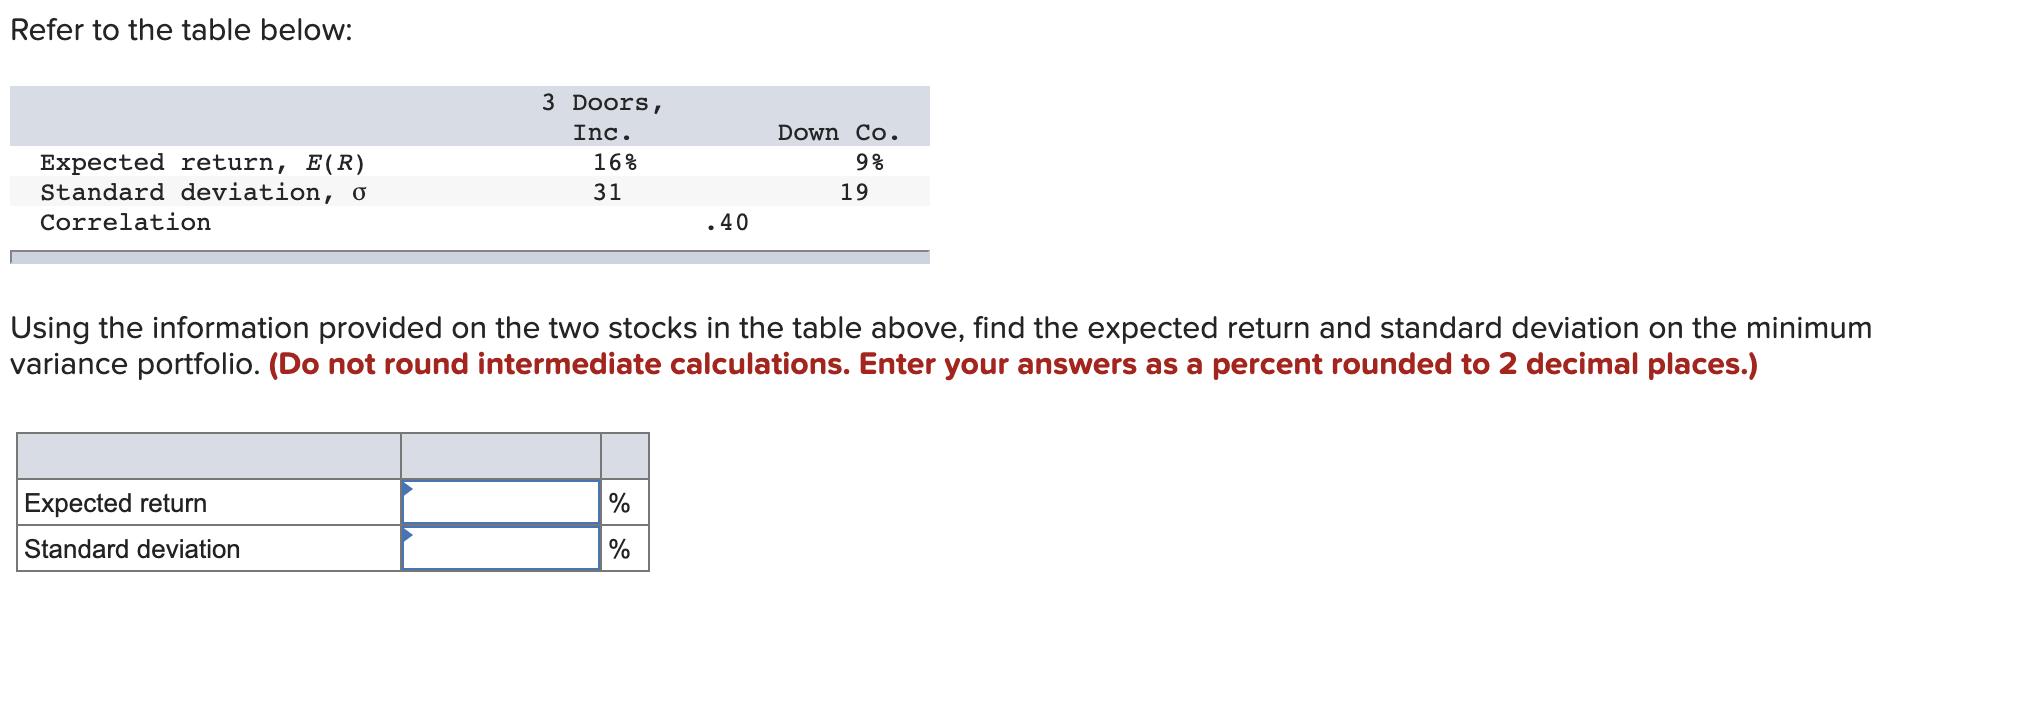
Refer to the table below: Expected return, E(R) Standard deviation, o Correlation 3 Doors, Inc. 16% 31 Down Co. 9% 19 .40 Using the

Refer to the table below: Expected return, E(R) Standard deviation, o Correlation 3 Doors, Inc. 16% 31 Down Co. 9% 19 .40 Using the information provided on the two stocks in the table above, find the expected return and standard deviation on the minimum variance portfolio. (Do not round intermediate calculations. Enter your answers as a percent rounded to 2 decimal places.) Expected return Standard deviation % %
Step by Step Solution
There are 3 Steps involved in it
Step: 1

Get Instant Access to Expert-Tailored Solutions
See step-by-step solutions with expert insights and AI powered tools for academic success
Step: 2

Step: 3

Ace Your Homework with AI
Get the answers you need in no time with our AI-driven, step-by-step assistance
Get StartedRecommended Textbook for
Fundamentals of Investments, Valuation and Management
Authors: Bradford Jordan, Thomas Miller, Steve Dolvin
8th edition
1259720697, 1259720691, 1260109437, 9781260109436, 978-1259720697
Students also viewed these Finance questions
Question
Answered: 1 week ago
Question
Answered: 1 week ago
Question
Answered: 1 week ago
Question
Answered: 1 week ago
Question
Answered: 1 week ago
Question
Answered: 1 week ago
Question
Answered: 1 week ago
Question
Answered: 1 week ago
Question
Answered: 1 week ago
Question
Answered: 1 week ago
Question
Answered: 1 week ago
Question
Answered: 1 week ago
Question
Answered: 1 week ago
Question
Answered: 1 week ago
Question
Answered: 1 week ago
Question
Answered: 1 week ago
Question
Answered: 1 week ago
Question
Answered: 1 week ago
Question
Answered: 1 week ago
Question
Answered: 1 week ago
Question
Answered: 1 week ago
Question
Answered: 1 week ago
View Answer in SolutionInn App


