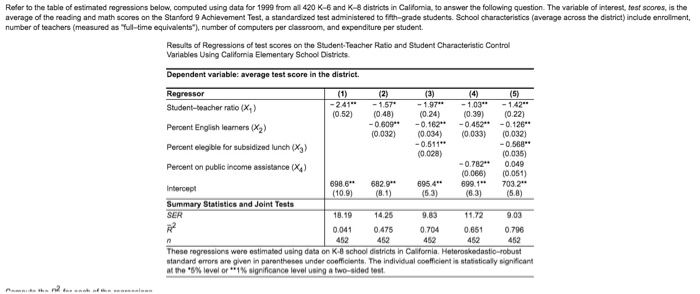
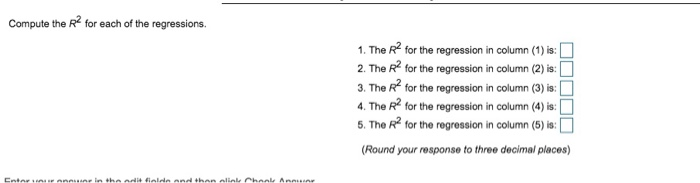
Refer to the table of estimated regressions below, computed using data for 1999 from all 420 K-6 and K-8 districts in Calfomia, to answer the following question. The variable of interest, tost soores, is the average of the reading and math scores on the Stanford 9 Achievement Test, a standardized test administered to fifth grade students. School characteristics (average across the district) include enrollment number of teachers (measured as Tull-time equivalents), number of computers per dlassroom, and expenditure per student Results of Regressions of test scores on the Student-Teacher Ratio and Student Characteristic Contro Variables Using Califomia Elementary School Districts Dependent variable: average test score in the district Student-beacher ratio(x Peront Engish learners (%) Percent elegible for subsidized lunch (Kg) Percent on public income assistance ) 03 (5) (0.52) (048) (0.24) 0.39) (022) 0.6090.162*0.452-0.126 (0.032) .034) (0033) (0.032) 0.568 (0.035) 0.782 0.049 (0.066) (0.051) 0.511 0.028) 698.6682.96954699.1 703.2 10 Statistics and Joint Tests SER 18.1 4.2 83 0041 04 0.704 0651 0.796 462 20651903 452 regressions were estimated using data on K-B school districts in standard erors are given in parentheses under coefficients. The individual coefficient is statistically signf cant at the .5% level or .. 1 % sigrificance love. usng a two-sided test Compute the R2 for each of the regressions. 1. The R? for the regression in column (1) is: 2, The R2 for the regression in column (2) is: 3. The R? for the regression in column (3) is: 4. The R for the regression in column (4) is: 5. The R2 for the regression in column (5) is: Round your response to three decimal places)