

Answered step by step
Verified Expert Solution
Question
1 Approved Answer
Refer to the Treasury-note and Treasury-bond quotes in Table 6-1. a. What is the asking price on the 1.375 percent May 2020 Treasury-bond if
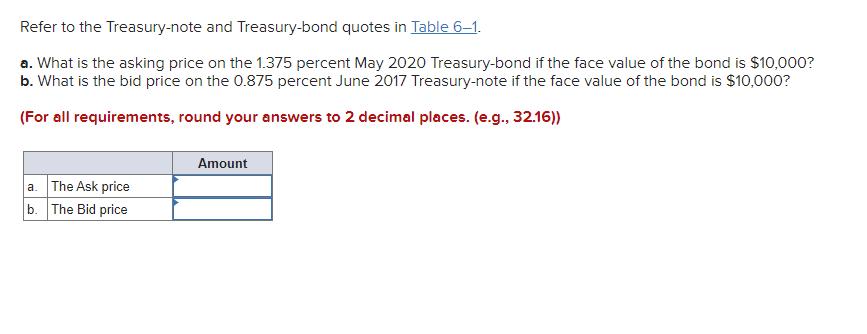
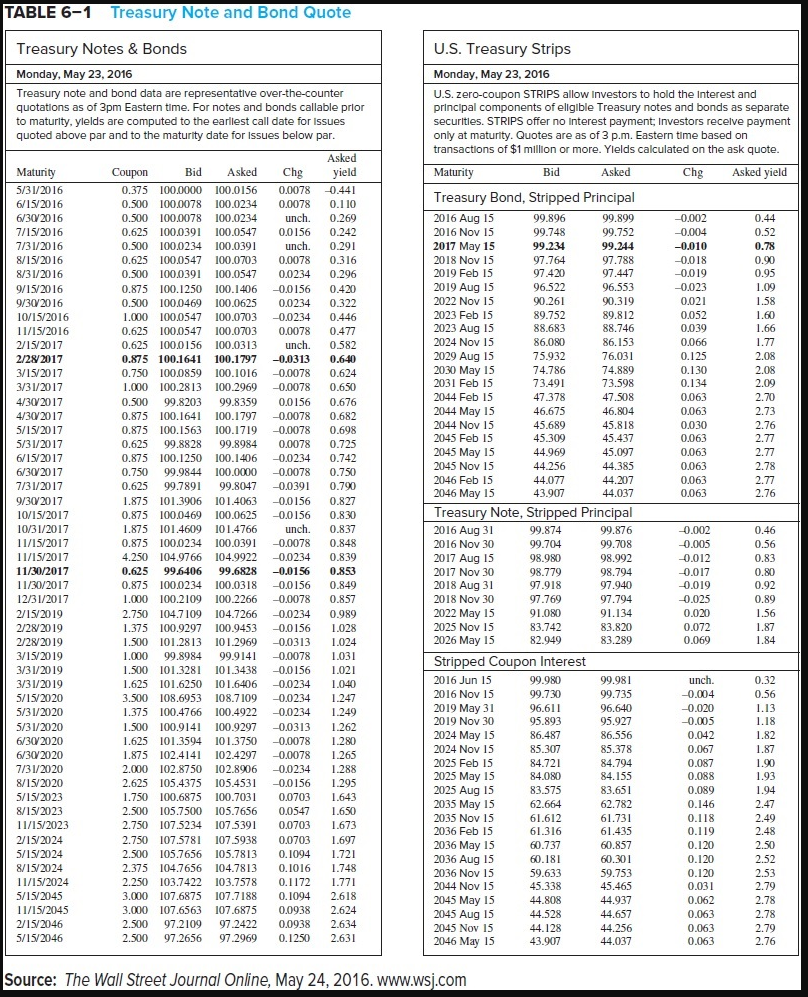
Refer to the Treasury-note and Treasury-bond quotes in Table 6-1. a. What is the asking price on the 1.375 percent May 2020 Treasury-bond if the face value of the bond is $10,000? b. What is the bid price on the 0.875 percent June 2017 Treasury-note if the face value of the bond is $10,000? (For all requirements, round your answers to 2 decimal places. (e.g., 32.16)) a. The Ask price b. The Bid price Amount TABLE 6-1 Treasury Note and Bond Quote Treasury Notes & Bonds Monday, May 23, 2016 Treasury note and bond data are representative over-the-counter quotations as of 3pm Eastern time. For notes and bonds callable prior to maturity, yields are computed to the earliest call date for Issues quoted above par and to the maturity date for Issues below par. U.S. Treasury Strips Monday, May 23, 2016 U.S. zero-coupon STRIPS allow Investors to hold the Interest and principal components of eligible Treasury notes and bonds as separate securities. STRIPS offer no interest payment; Investors receive payment only at maturity. Quotes are as of 3 p.m. Eastern time based on transactions of $1 million or more. Yields calculated on the ask quote. Maturity Asked yield Chg Maturity 5/31/2016 Coupon 6/15/2016 0.500 100.0078 6/30/2016 0.500 100.0078 7/15/2016 0.625 100.0391 7/31/2016 8/15/2016 8/31/2016 9/15/2016 Asked 0.375 100.0000 100.0156 100.0234 100.0234 100.0547 0.500 100.0234 100.0391 0.625 100.0547 100.0703 0.500 100.0391 0.875 100.1250 Bid Asked Chg yield 0.0078 -0.441 0.0078 0.110 unch. 0.269 0.0156 0.242 unch. Bid Asked Treasury Bond, Stripped Principal 2016 Aug 15 99.896 99.899 -0.002 0.44 2016 Nov 15 99.748 99.752 -0.004 0.52 0.291 2017 May 15 99.234 99.244 -0.010 0.78 0.0078 0.316 2018 Nov 15 97.764 97.788 -0.018 0.90 100.0547 0.0234 0.296 2019 Feb 15 97.420 97.447 -0.019 0.95 100.1406 -0.0156 0.420 2019 Aug 15 96.522 96.553 -0.023 1.09 9/30/2016 0.500 100.0469 100.0625 0.0234 0.322 2022 Nov 15 90.261 90.319 0.021 1.58 10/15/2016 11/15/2016 2/15/2017 1.000 100.0547 0.625 100.0547 100.0703 0.625 100.0156 100.0313 100.0703 -0.0234 0.446 2023 Feb 15 89.752 89.812 0.052 1.60 0.0078 0.477 2023 Aug 15 88.683 88.746 0.039 1.66 unch. 0.582 2024 Nov 15 86.080 86.153 0.066 1.77 2/28/2017 3/15/2017 3/31/2017 4/30/2017 4/30/2017 5/15/2017 0.875 100.1641 100.1797 0.750 100.0859 100.1016 1.000 100.2813 0.500 99.8203 -0.0313 0.640 2029 Aug 15 75.932 76.031 0.125 2.08 -0.0078 0.624 2030 May 15 74.786 74.889 0.130 2.08 100.2969 -0.0078 0.650 2031 Feb 15 73.491 73.598 0.134 2.09 99.8359 0.0156 0.676 2044 Feb 15 47.378 47.508 0.063 2.70 0.875 100.1641 100.1797 -0.0078 0.682 2044 May 15 46.675 46.804 0.063 2.73 5/31/2017 6/15/2017 6/30/2017 7/31/2017 9/30/2017 10/15/2017 10/31/2017 0.875 100.1563 100.1719 0.625 99.8828 99.8984 0.0078 0.725 0.875 100.1250 100.1406 -0.0234 0.750 99.9844 100.0000 -0.0078 0.750 0.625 99.7891 99.8047 -0.0391 0.790 1.875 101.3906 101.4063 -0.0156 0.827 0.875 100.0469 100.0625 -0.0156 1.875 101.4609 101.4766 2044 Nov 15 45.689 -0.0078 0.698 45.818 0.030 2.76 2045 Feb 15 45.309 45.437 0.063 2.77 0.742 2045 May 15 44.969 45.097 0.063 2.77 2045 Nov 15 44.256 44.385 0.063 2.78 2046 Feb 15 44.077 44.207 0.063 2.77 2046 May 15 43.907 44.037 0.063 2.76 0.830 Treasury Note, Stripped Principal unch. 0.837 2016 Aug 31 99.874 99.876 -0.002 0.46 11/15/2017 0.875 100.0234 100.0391 -0.0078 0.848 2016 Nov 30 99.704 99.708 -0.005 0.56 11/15/2017 11/30/2017 4.250 104.9766 104.9922 0.625 99.6406 99.6828 -0.0234 0.839 2017 Aug 15 98.980 98.992 -0.012 0.83 -0.0156 0.853 2017 Nov 30 98.779 98.794 -0.017 0.80 11/30/2017 12/31/2017 2/15/2019 2/28/2019 2/28/2019 3/15/2019 3/31/2019 3/31/2019 5/15/2020 5/31/2020 5/31/2020 6/30/2020 6/30/2020 7/31/2020 8/15/2020 5/15/2023 8/15/2023 0.875 100.0234 100.0318 -0.0156 0.849 1.000 100.2109 100.2266 -0.0078 0.857 2.750 104.7109 104.7266 -0.0234 1.375 100.9297 100.9453 -0.0156 1.500 101.2813 101.2969 -0.0313 1.024 1.000 99.8984 99.9141 -0.0078 1.031 1.500 101.3281 101.3438 -0.0156 1.021 1.625 101.6250 101.6406 -0.0234 1.040 -0.0234 3.500 108.6953 108.7109 1.247 1.375 100.4766 100.4922 -0.0234 1.249 1.500 100.9141 100.9297 -0.0313 1.262 1.625 101.3594 101.3750 -0.0078 1.875 102.4141 102.4297 -0.0078 1.265 2.000 102.8750 102.8906 -0.0234 1.288 2.625 105.4375 105.4531 -0.0156 1.295 1.750 100.6875 100.7031 0.0703 2.500 105.7500 105.7656 0.0547 2018 Aug 31 97.918 97.940 -0.019 0.92 2018 Nov 30 97.769 97.794 -0.025 0.89 0.989 2022 May 15 91.080 91.134 0.020 1.56 1.028 2025 Nov 15 83.742 83.820 0.072 1.87 2026 May 15 82.949 83.289 0.069 1.84 Stripped Coupon Interest 2016 Jun 15 99.980 99.981 unch. 0.32 2016 Nov 15 99.730 99.735 -0.004 0.56 2019 May 31 96.611 96.640 -0.020 1.13 2019 Nov 30 95.893 95.927 -0.005 1.18 2024 May 15 86.487 86.556 0.042 1.82 1.280 2024 Nov 15 85.307 85.378 0.067 1.87 2025 Feb 15 84.721 84.794 0.087 1.90 2025 May 15 84.080 84.155 0.088 1.93 1.643 2025 Aug 15 83.575 83.651 0.089 1.94 2035 May 15 62.664 62.782 0.146 2.47 1.650 2035 Nov 15 61.612 61.731 11/15/2023 0.118 2.49 2.750 107.5234 107.5391 0.0703 1.673 2036 Feb 15 61.316 61.435 0.119 2.48 2/15/2024 5/15/2024 2.750 107.5781 107.5938 0.0703 1.697 2.500 105.7656 105.7813 2036 May 15 60.737 60.857 0.120 2.50 0.1094 1.721 2036 Aug 15 60.181 60.301 0.120 2.52 8/15/2024 11/15/2024 5/15/2045 11/15/2045 2.375 104.7656 104.7813 2.250 103.7422 103.7578 3.000 107.6875 107.7188 3.000 107.6563 107.6875 0.1016 1.748 2036 Nov 15 59.633 59.753 0.120 2.53 0.1172 1.771 2044 Nov 15 45.338 45.465 0.031 2.79 0.1094 2.618 2045 May 15 44.808 44.937 0.062 2.78 0.0938 2.624 2045 Aug 15 44.528 44.657 0.063 2.78 2/15/2046 5/15/2046 2.500 97.2109 97.2422 0.0938 2.634 2.500 97.2656 97.2969 0.1250 2.631 2045 Nov 15 44.128 44.256 0.063 2.79 2046 May 15 43.907 44.037 0.063 2.76 Source: The Wall Street Journal Online, May 24, 2016. www.wsj.com
Step by Step Solution
There are 3 Steps involved in it
Step: 1

Get Instant Access to Expert-Tailored Solutions
See step-by-step solutions with expert insights and AI powered tools for academic success
Step: 2

Step: 3
Ace Your Homework with AI
Get the answers you need in no time with our AI-driven, step-by-step assistance
Get Started
Introduction to Operations Research
Authors: Frederick S. Hillier, Gerald J. Lieberman
10th edition
978-0072535105, 72535105, 978-1259162985