Answered step by step
Verified Expert Solution
Link Copied!

Question

1 Approved Answer

Referring to Table 7 .1 in the text: a. Calculate the R2 for each of the regressions. b. Calculate the homoskedasticity-only F-statistic for testing b3

Referring to Table 7 .1 in the text: a. Calculate the R2 for each of the regressions. b. Calculate the homoskedasticity-only F-statistic for testing b3 = b4 = 0 in the regression shown in column (5). Is the statistic significant at the 5% level? c. Test b3 = b4 = 0 in the regression shown in column (5) using the Bonferroni test discussed in Appendix 7 .1. d. Construct a 99% confidence interval for b1 for the regression in column (5).

On the website http://www.pearsonhighered.com/stock_watson/, you will find the data file "Earnings_and_Height" that contains the data, to do the exercise.
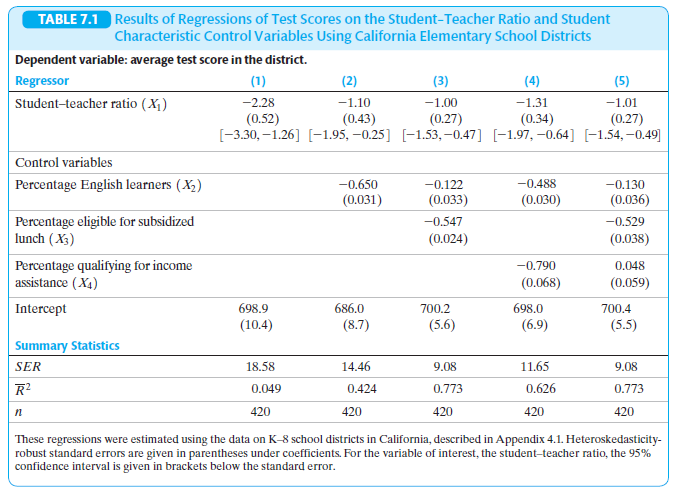
image text in transcribed
TABLE 7.1 Results of Regressions of Test Scores on the Student-Teacher Ratio and Student Characteristic Control Variables Using California Elementary School Districts Dependent variable: average test score in the district. Regressor (1) (2) (3) (4) (5) Student-teacher ratio (X ) -2.28 -1.10 -1.00 -1.31 -1.01 (0.52) (0.43) (0.27) (0.34) (0.27) [-3.30, -1.26] [-1.95, -0.25] [-1.53,-0.47] [-1.97, -0.64] [-1.54, -0.49] Control variables Percentage English learners (X2) -0.650 -0.122 -0.488 -0.130 (0.031) (0.033) (0.030) (0.036) Percentage eligible for subsidized -0.547 -0.529 lunch (X3) (0.024) (0.038) Percentage qualifying for income -0.790 0.048 assistance ( X4) (0.068) (0.059) Intercept 698.9 686.0 700.2 698.0 700.4 (10.4) (8.7) (5.6) (6.9) (5.5) Summary Statistics SER 18.58 14.46 9.08 11.65 9.08 R 0.049 0.424 0.773 0.626 0.773 420 420 420 420 420 These regressions were estimated using the data on K-8 school districts in California, described in Appendix 4.1. Heteroskedasticity- robust standard errors are given in parentheses under coefficients. For the variable of interest, the student-teacher ratio, the 95% confidence interval is given in brackets below the standard error

Step by Step Solution

There are 3 Steps involved in it

Step: 1

blur-text-image

Get Instant Access to Expert-Tailored Solutions

See step-by-step solutions with expert insights and AI powered tools for academic success

Step: 2

blur-text-image

Step: 3

blur-text-image

Ace Your Homework with AI

Get the answers you need in no time with our AI-driven, step-by-step assistance

Get Started

Recommended Textbook for

An Introduction to the Mathematics of Financial Derivatives

Authors: Ali Hirsa, Salih N. Neftci

3rd edition

012384682X, 978-0123846822

More Books

Students also viewed these Mathematics questions

Question

How is slaked lime powder prepared ?

Answered: 1 week ago

Question

Why does electric current flow through acid?

Answered: 1 week ago

Question

What is Taxonomy ?

Answered: 1 week ago

Question

1. In taxonomy which are the factors to be studied ?

Answered: 1 week ago