Answered step by step
Verified Expert Solution
Question
1 Approved Answer
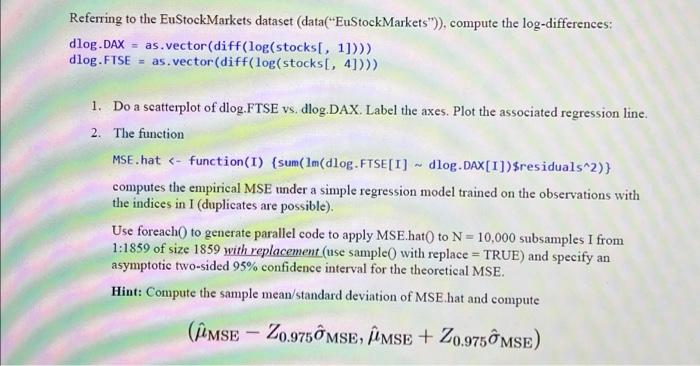
Referring to the EuStock Markets dataset (data(EuStock Markets)), compute the log-differences: dlog.DAX = as.vector(diff(log(stocks[, 1]))) dlog.FTSE = as.vector(diff(log(stocks[, 4]))) 1. Do a scatterplot of dlog.FTSE
Step by Step Solution
There are 3 Steps involved in it
Step: 1

Get Instant Access to Expert-Tailored Solutions
See step-by-step solutions with expert insights and AI powered tools for academic success
Step: 2

Step: 3
Ace Your Homework with AI
Get the answers you need in no time with our AI-driven, step-by-step assistance
Get Started