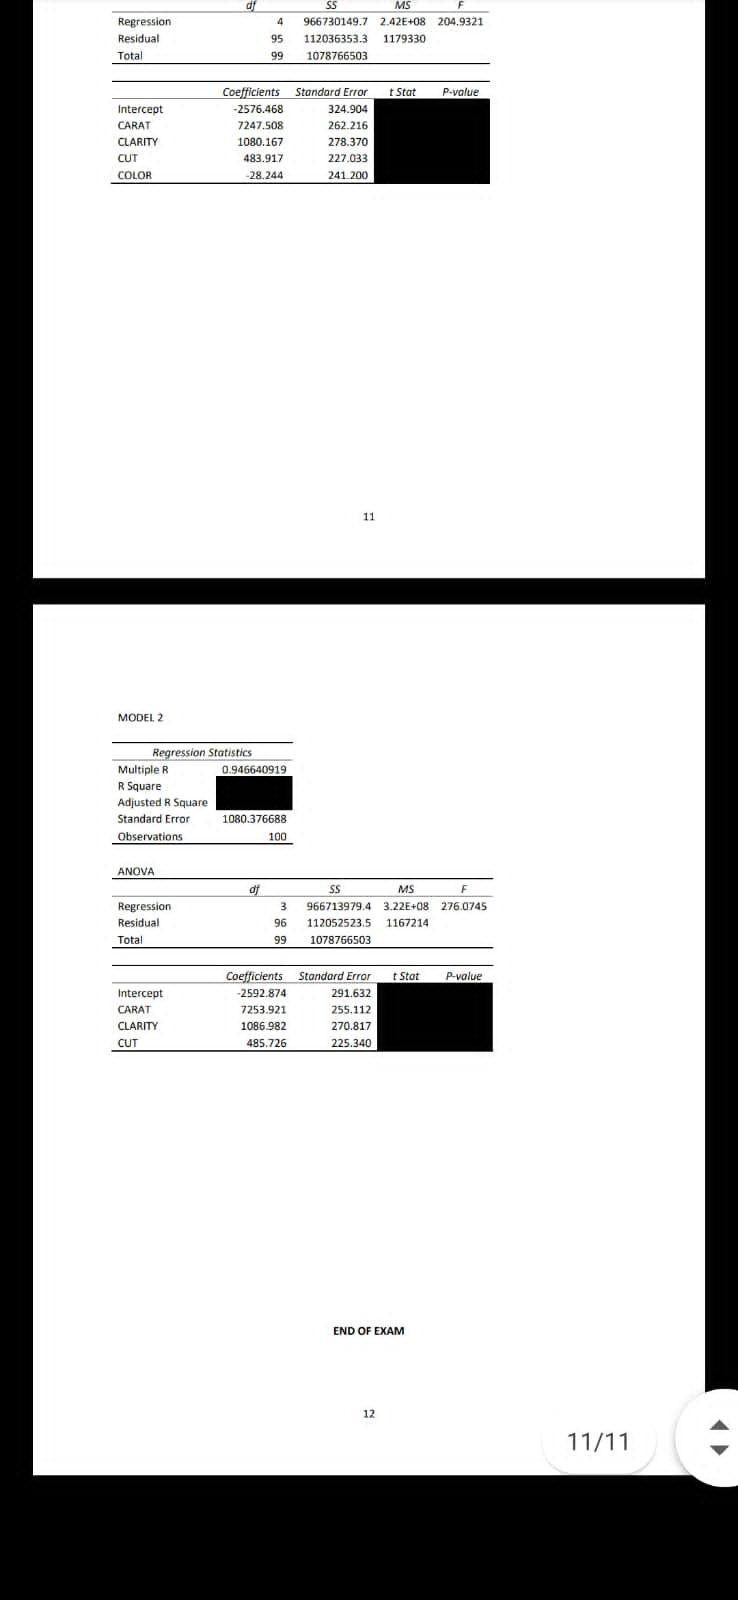
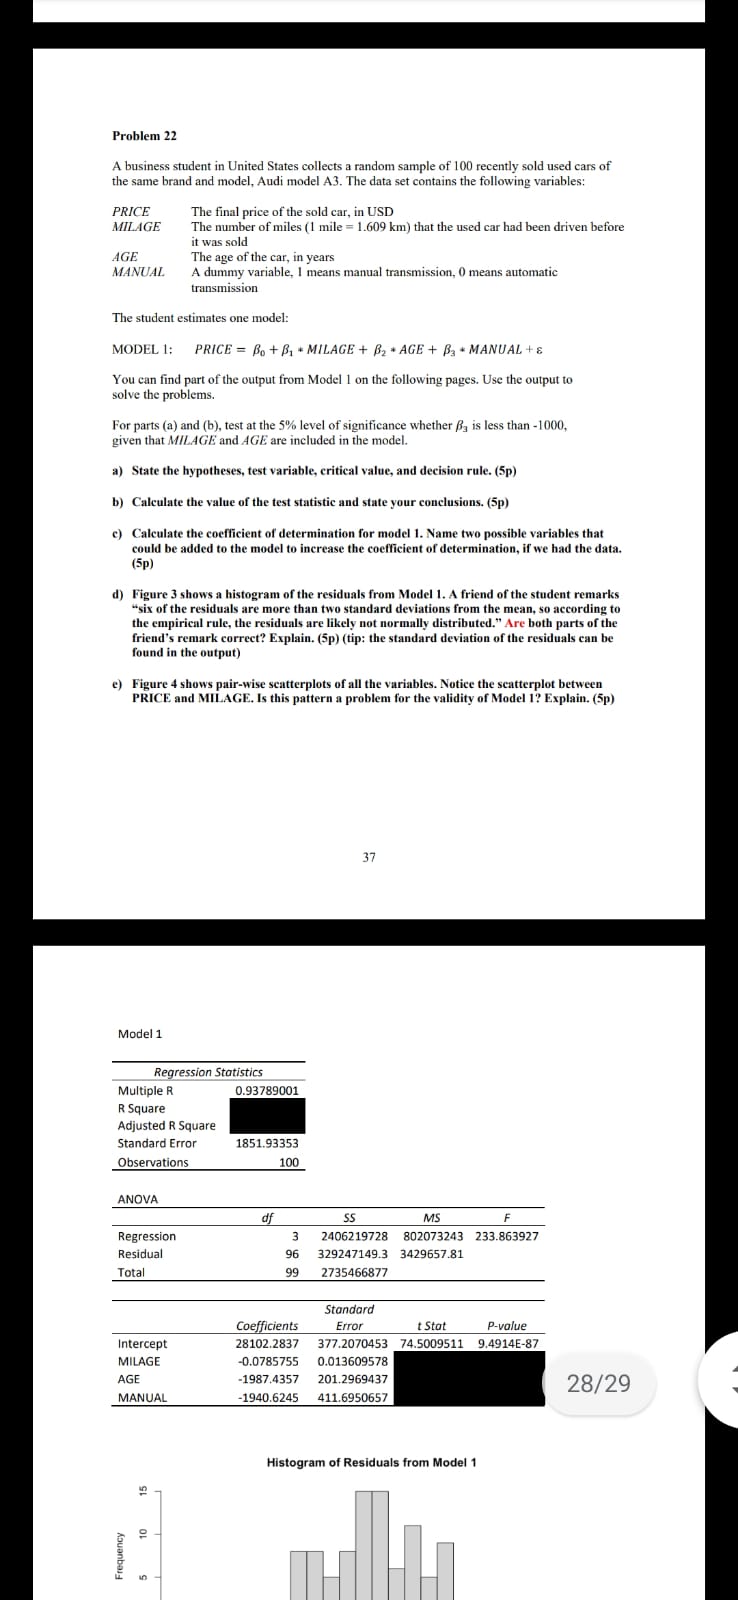
Regression 4 966730149.7 2.42E+08 204.9321 Residual 95 112036353.3 1179330 Tota 1078766503 Coefficients Standard Error Stat P-value Intercept 2576.468 324.904 CARAT 7247.508 262.216 CLARITY 1080.167 278.370 CUT 483.917 227.033 COLOR -28.244 241 200 11 MODEL 2 Regression Statistics Multiple R 0.946640919 R Square Adjusted R Square Standard Error 1080.376688 Observations 100 ANOVA SS MS Regression 3 966713979.4 3.22E+08 276.0745 Residual 96 112052523.5 1167214 Total 99 1078766503 Coefficients Standard Error t Stat P-value Intercept 2592.874 291.632 CARAT 7253.921 255.112 CLARITY 1086.982 270.817 CUT 485.726 225.340 END OF EXAM 12 11/11Problem 22 A business student in United States collects a random sample of 100 recently sold used cars of the same brand and model, Audi model A3. The data set contains the following variables: PRICE The final price of the sold car, in USD MILAGE The number of miles (1 mile = 1.609 km) that the used car had been driven before it was sold AGE The age of the car, in years MANUAL A dummy variable, 1 means manual transmission, 0 means automatic transmission The student estimates one model: MODEL 1: PRICE = Bo + B, * MILAGE + B2 * AGE + Ba * MANUAL + 8 You can find part of the output from Model 1 on the following pages. Use the output to solve the problems. For parts (a) and (b), test at the 5% level of significance whether By is less than -1000, given that MILAGE and AGE are included in the model. a) State the hypotheses, test variable, critical value, and decision rule. (5p) b) Calculate the value of the test statistic and state your conclusions. (5p) ") Calculate the coefficient of determination for model 1. Name two possible variables that could be added to the model to increase the coefficient of determination, if we had the data. (5p) d) Figure 3 shows a histogram of the residuals from Model 1. A friend of the student remarks "six of the residuals are more than two standard deviations from the mean, so according to the empirical rule, the residuals are likely not normally distributed." Are both parts of the friend's remark correct? Explain. (5p) (tip: the standard deviation of the residuals can be found in the output) e) Figure 4 shows pair-wise scatterplots of all the variables. Notice the scatterplot between PRICE and MILAGE. Is this pattern a problem for the validity of Model 1? Explain. (5p) 37 Model 1 Regression Statistics Multiple R 0.93789001 R Square Adjusted R Square Standard Error 1851.93353 Observations 100 ANOVA dif SS MS Regression 3 2406219728 802073243 233.863927 Residual 96 329247149.3 3429657.81 Total 99 2735466877 Standard Coefficients Error t Stat P-value Intercept 28102.2837 377.2070453 74.5009511 9.4914E-87 MILAGE 0.0785755 0.013609578 AGE 1987.4357 201.2969437 28/29 MANUAL -1940.6245 411.6950657 Histogram of Residuals from Model 1 Frequency