

Question
Regression Equation: Provide the regression equation for the line of best fit using the scatterplot from the Module Two assignment. Determiner: Determinerand what it means.
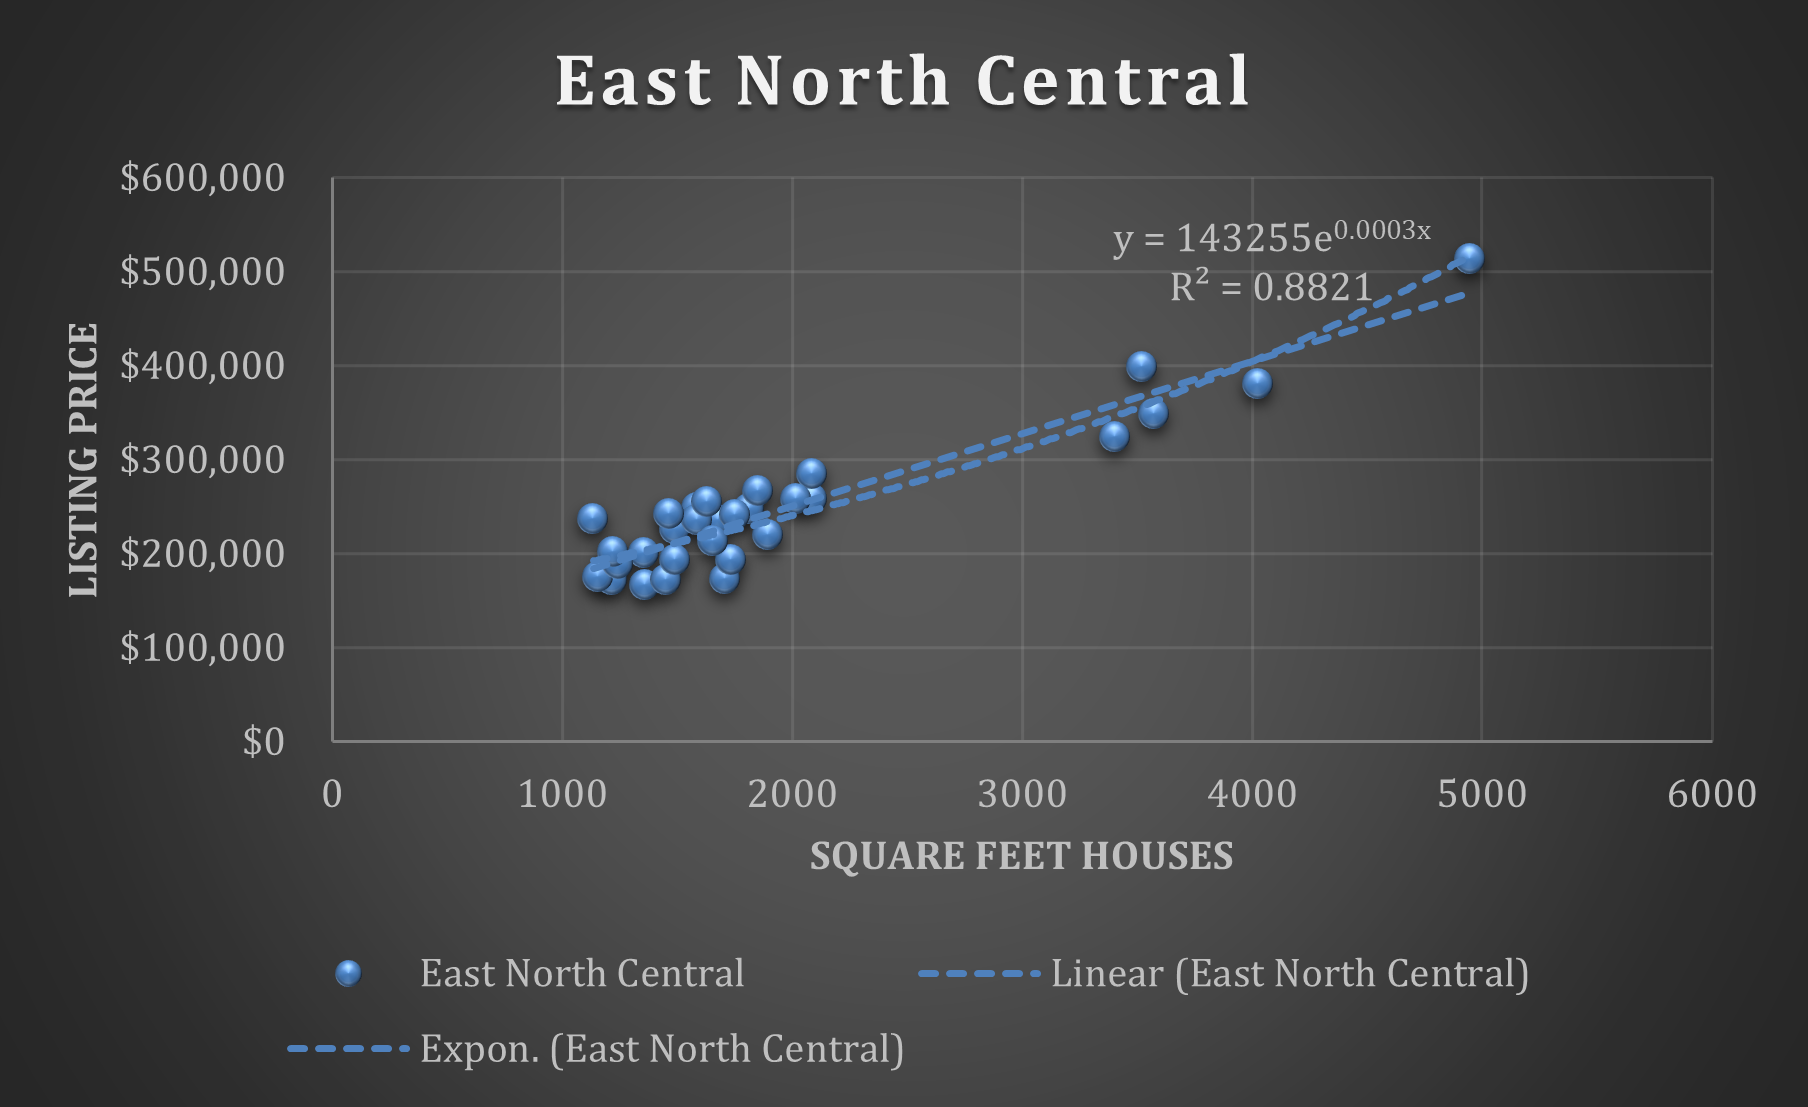
Regression Equation:Provide the regression equation for the line of best fit using the scatterplot from the Module Two assignment.
Determiner:Determinerand what it means. (What is the relationship between the variables?)
Determine the strength of the correlation (weak, moderate, or strong).
Discuss how you determine the direction of the association between the two variables.
Is there a positive or negative association?
What do you see as the direction of the correlation?
Examine the Slope and Intercepts:Examine the slope b1 and intercept b0
Draw conclusions from the slope and intercept in the context of this problem.
Does the intercept make sense based on your observation of the line of best fit?
Determine the value of the land only.
Note:You can assume, when the square footage of the house is zero, that the price is the value of just the land. This happens whenx=0, which is they-intercept. Does this value make sense in context?
Determine theR-squared Coefficient:Determine theR-squared value.
Discuss whatR-squared means in the context of this analysis.
Conclusions:Reflect on the Relationship: Reflect on the relationship between square feet and sales price by answering the following questions:
Is the square footage for homes in your selected region different than for homes overall in the United States?
For every 100 square feet, how much does the price go up (i.e., can you use slope to help identify price changes)?
What square footage range would the graph be best used for?
Data
In the region of East North Central using the data of 30 sample units,
Listing Price:
Mean: 248443.33
Median: 236100
Standard Deviation: 77569.21
Square Feet
Mean: 1973.37
Median: 1670.5
Standard Deviation: 941.71
Data Analysis
The regional sample created reflects the national market because of the number's relation to the graphs. The data will vary based on each region due to higher or lower pricing areas but if you look at the relation of the mean, median, and standard deviation in relation to the national statistics graph the numbers reflect similarities in the mean median and standard deviations. The first thing I did was sort the regional sample by region, East North Central was at the top. I create a new column to create a random number section with the formula =RAND () then I sort only East North Central by random numbers for small to large I copy the first 30 and paste them into another sheet so I can work better and see what I am doing. Taking samples from one region is reflective of the national market being part of the same population. With the method, I can say that we can keep our samples truly random. This method generates a different sample from the population.
Scatterplot
Step by Step Solution
There are 3 Steps involved in it
Step: 1

Get Instant Access to Expert-Tailored Solutions
See step-by-step solutions with expert insights and AI powered tools for academic success
Step: 2

Step: 3
Ace Your Homework with AI
Get the answers you need in no time with our AI-driven, step-by-step assistance
Get Started
A First Course In Differential Equations
Authors: J David Logan
3rd Edition
3319178520, 9783319178523