Answered step by step
Verified Expert Solution
Question
1 Approved Answer
Remember to draw log of output per worker as a function of time for part b. There has to be a solow graph based on
Remember to draw log of output per worker as a function of time for part b. There has to be a solow graph based on the question for part b, Thumbs up if you include a graph and get it correct. Thank you!

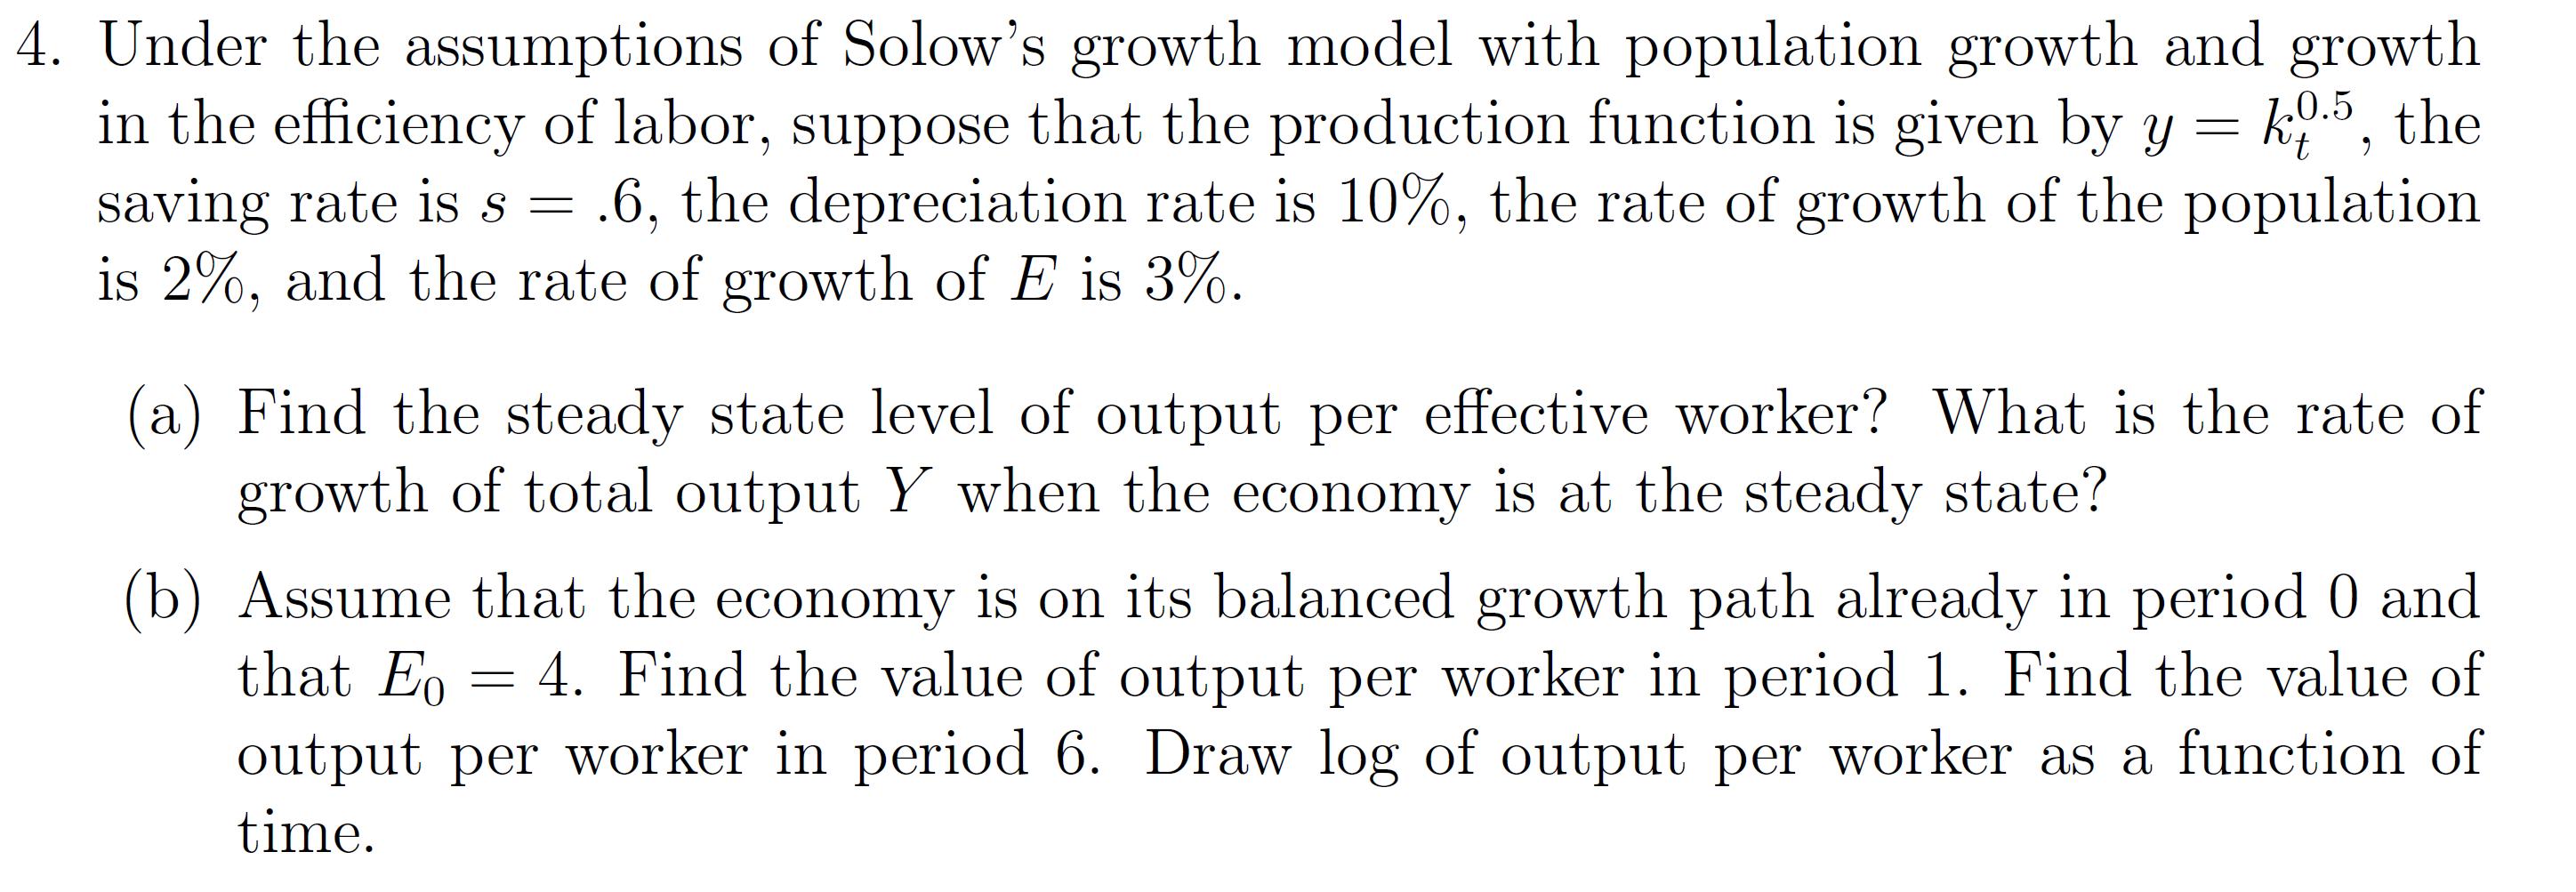
4. Under the assumptions of Solow's growth model with population growth and growth. in the efficiency of labor, suppose that the production function is given by y = ko.5, the saving rate is s = .6, the depreciation rate is 10%, the rate of growth of the population is 2%, and the rate of growth of E is 3%. (a) Find the steady state level of output per effective worker? What is the rate of growth of total output Y when the economy is at the steady state? Eo (b) Assume that the economy is on its balanced growth path already in period 0 and that E0 = 4. Find the value of output per worker in period 1. Find the value of output per worker in period 6. Draw log of output per worker as a function of time.
Step by Step Solution
★★★★★
3.41 Rating (151 Votes )
There are 3 Steps involved in it
Step: 1
Sure lets simplify the explanation of Solows growth model Part a Imagine the economy is in a steady ...
Get Instant Access to Expert-Tailored Solutions
See step-by-step solutions with expert insights and AI powered tools for academic success
Step: 2

Step: 3

Ace Your Homework with AI
Get the answers you need in no time with our AI-driven, step-by-step assistance
Get Started


