Answered step by step
Verified Expert Solution
Question
1 Approved Answer
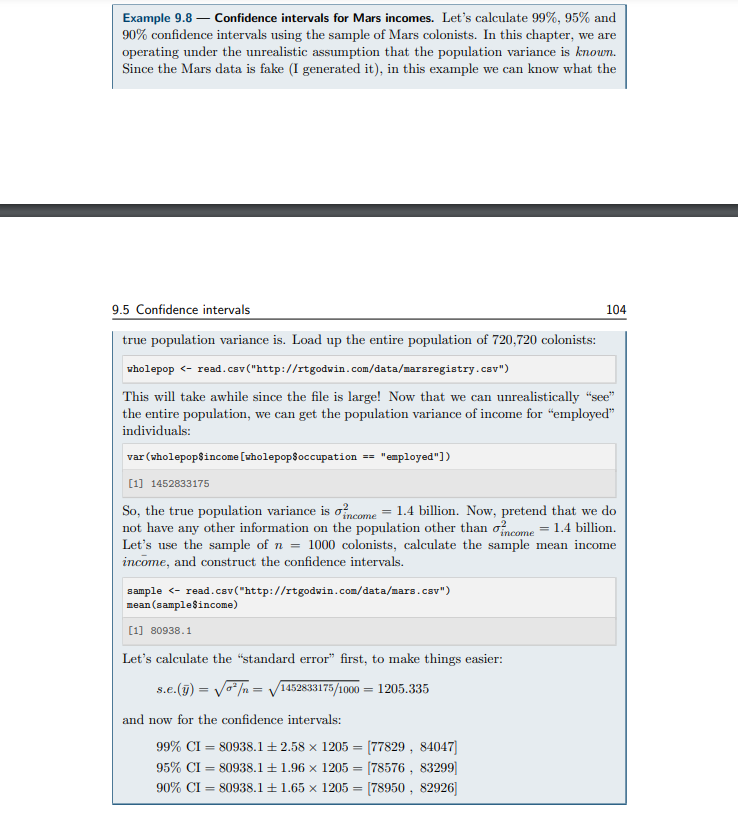
Replicate Example 9.8 but replace income with height and report only the 95% confidence intercal. Then, interpret the confidence interval. Example 9.8 - Confidence intervals

Replicate Example 9.8 but replace income with height and report only the 95% confidence intercal. Then, interpret the confidence interval.
Example 9.8 - Confidence intervals for Mars incomes. Let's calculate 99%,95% and 90% confidence intervals using the sample of Mars colonists. In this chapter, we are operating under the unrealistic assumption that the population variance is known. Since the Mars data is fake (I generated it), in this example we can know what the 9.5 Confidence intervals 104 true population variance is. Load up the entire population of 720,720 colonists: uholepop var (wholepopsincome [wholepopSoccupation == "employed"]) [1] 1452833175 So, the true population variance is income2=1.4 billion. Now, pretend that we do not have any other information on the population other than income2=1.4 billion. Let's use the sample of n=1000 colonists, calculate the sample mean income income, and construct the confidence intervals. sample 80938.1 Let's calculate the "standard error" first, to make things easier: s.e.(y)=2=1452833175/1000=1205.335 and now for the confidence intervals: 99%CI=80938.12.581205=[77829,84047]95%CI=80938.11.961205=[78576,83299]90%CI=80938.11.651205=[78950,82926] Example 9.8 - Confidence intervals for Mars incomes. Let's calculate 99%,95% and 90% confidence intervals using the sample of Mars colonists. In this chapter, we are operating under the unrealistic assumption that the population variance is known. Since the Mars data is fake (I generated it), in this example we can know what the 9.5 Confidence intervals 104 true population variance is. Load up the entire population of 720,720 colonists: uholepop var (wholepopsincome [wholepopSoccupation == "employed"]) [1] 1452833175 So, the true population variance is income2=1.4 billion. Now, pretend that we do not have any other information on the population other than income2=1.4 billion. Let's use the sample of n=1000 colonists, calculate the sample mean income income, and construct the confidence intervals. sample 80938.1 Let's calculate the "standard error" first, to make things easier: s.e.(y)=2=1452833175/1000=1205.335 and now for the confidence intervals: 99%CI=80938.12.581205=[77829,84047]95%CI=80938.11.961205=[78576,83299]90%CI=80938.11.651205=[78950,82926]Step by Step Solution
There are 3 Steps involved in it
Step: 1

Get Instant Access to Expert-Tailored Solutions
See step-by-step solutions with expert insights and AI powered tools for academic success
Step: 2

Step: 3

Ace Your Homework with AI
Get the answers you need in no time with our AI-driven, step-by-step assistance
Get Started


