

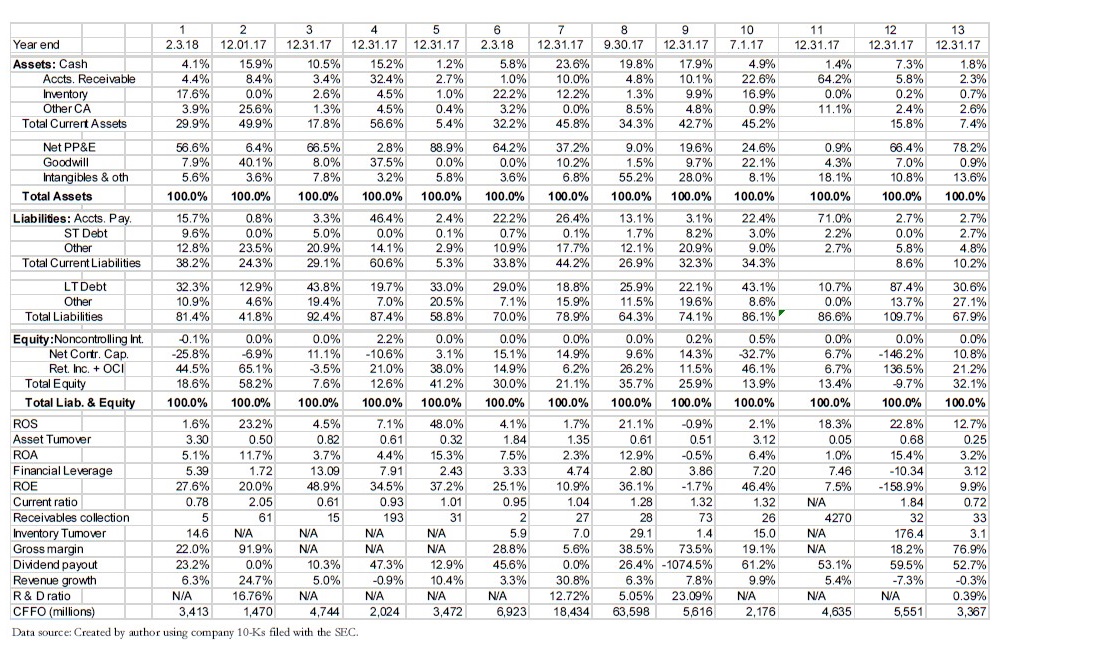
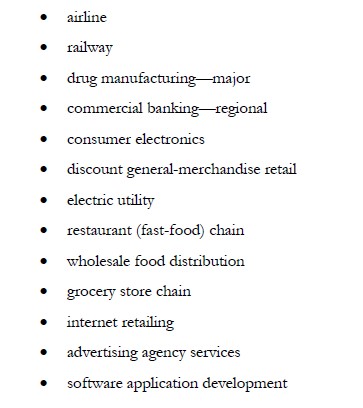
Requesting input/assistance in matching the industries to the ratios given the financial data Ratio Industry Reasoning 1.
Fantastic news! We've Found the answer you've been seeking!
Question:
Requesting input/assistance in matching the industries to the ratios given the financial data
Ratio | Industry | Reasoning |
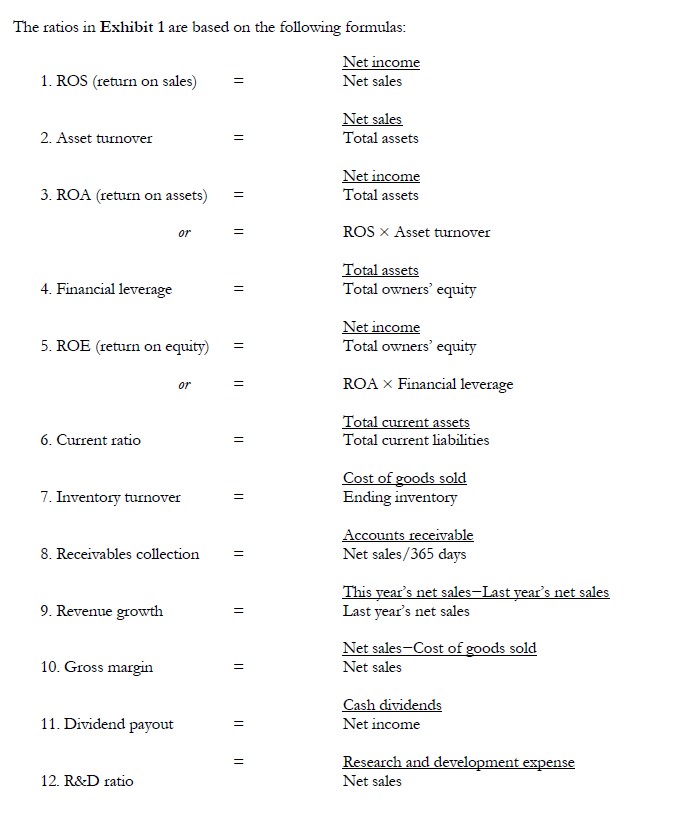
| 1. Return on sales | ||
| 2. Asset turnover | ||
| 3. Return on assets | ||
| 4. Financial leverage | ||
| 5. Return on equity | ||
| 6. Current ratio | ||
| 7. Inventory turnover | ||
| 8. Receivables collection | ||
| 9. Revenue Growth | ||
| 10. Gross Margin | ||
| 11. Dividend payout | ||
| 12. R&D ratio |
Expert Answer:
Here is my analysis of matching the industries to the ratios given the financial data 1 Return on sales Highest ROS would be in industries with high profit margins like drug manufacturing software dev... View the full answer

Related Book For 
International Financial Reporting and Analysis
ISBN: 978-1408075012
5th edition
Authors: David Alexander, Anne Britton, Ann Jorissen
Posted Date:
