

Question
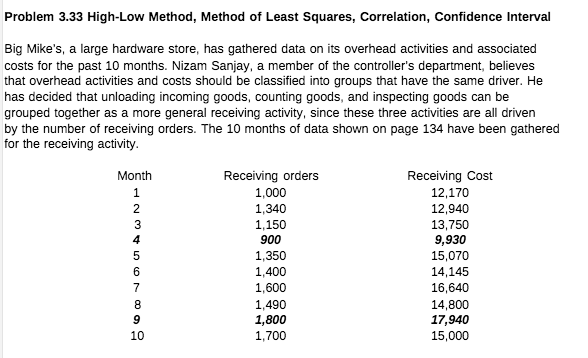
Required: 1. Prepare a scattergraph by plotting power costs against machine hours. Does the scattergraph show a linear relationship between machine hours and power cost?
Required:
1. Prepare a scattergraph by plotting power costs against machine hours. Does the scattergraph show a linear relationship between machine hours and power cost?
2. Using the high and low points, compute a power cost formula.
3. Use the method of least squares to compute a power cost formula. Evaluate the coefficient of determination.
4. Rerun the regression and drop the point (20,000; $26,000) as an outlier. Compute the results from this regression to those for the regression in Requirement 3. Which is better?
Step by Step Solution
There are 3 Steps involved in it
Step: 1

Get Instant Access to Expert-Tailored Solutions
See step-by-step solutions with expert insights and AI powered tools for academic success
Step: 2

Step: 3
Ace Your Homework with AI
Get the answers you need in no time with our AI-driven, step-by-step assistance
Get Started
Management And Cost Accounting Student Manual Free Tracked Delivery
Authors: Colin Drury, Mike Tayles
1st Edition
9781473773622