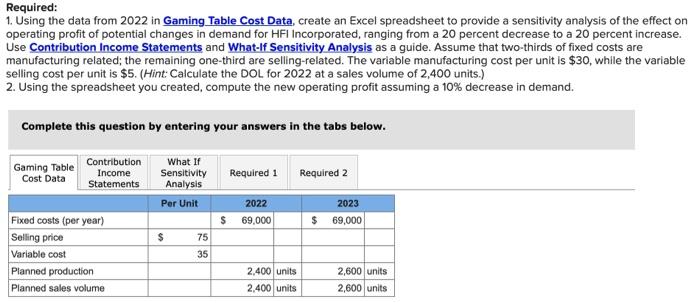
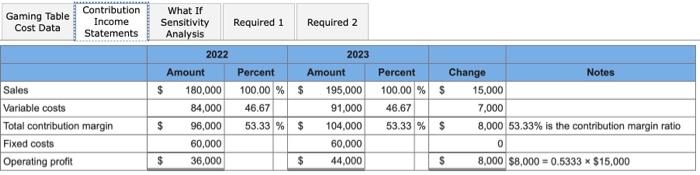
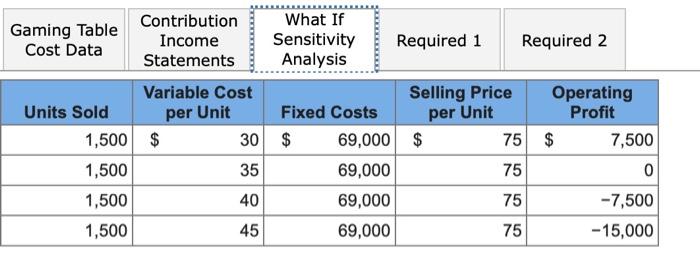
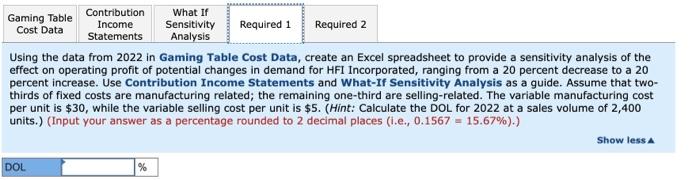
Required: 1. Using the data from 2022 in Gaming Table Cost Data, create an Excel spreadsheet to provide a sensitivity analysis of the effect on operating profit of potential changes in demand for HFI Incorporated, ranging from a 20 percent decrease to a 20 percent increase. Use Contribution Income Statements and What-If Sensitivity Analysis as a guide. Assume that two-thirds of fixed costs are manufacturing related; the remaining one-third are selling-related. The variable manufacturing cost per unit is $30, while the variable selling cost per unit is $5. (Hint: Calculate the DOL for 2022 at a sales volume of 2,400 units.) 2. Using the spreadsheet you created, compute the new operating profit assuming a 10% decrease in demand. Complete this question by entering your answers in the tabs below. Gaming Table Contribution Income Statements What If Sensitivity Analysis Required 1 Required 2 Cost Data Per Unit 2022 69,000 Fixed costs (per year) Selling price Variable cost Planned production Planned sales volume $ 75 35 $ 2,400 units 2,400 units 2023 $ 69,000 2,600 units 2,600 units Contribution Income Statements Gaming Table Cost Data Sales Variable costs Total contribution margin Fixed costs Operating profit What If Sensitivity Analysis Amount $ $ $ 2022 180,000 84,000 96,000 60,000 36,000 Required 1 Percent 100.00 % $ 46.67 53.33 % $ $ Required 2 Amount 2023 195,000 91,000 104,000 60,000 44,000 Percent 100.00 % $ 46.67 53.33 % $ $ Change Notes 15,000 7,000 8,000 53.33% is the contribution margin ratio 0 8,000 $8,000=0.5333 * $15,000 Gaming Table Cost Data Units Sold 1,500 1,500 1,500 1,500 Contribution Income Statements Variable Cost per Unit $ What If Sensitivity Analysis Fixed Costs 30 $ 35 40 45 69,000 69,000 69,000 69,000 Required 1 Selling Price per Unit $ Required 2 75 75 75 75 Operating Profit $ 7,500 0 -7,500 -15,000 What If Gaming Table Cost Data Contribution Income Statements Required 1 Required 2 Sensitivity Analysis Using the data from 2022 in Gaming Table Cost Data, create an Excel spreadsheet to provide a sensitivity analysis of the effect on operating profit of potential changes in demand for HFI Incorporated, ranging from a 20 percent decrease to a 20 percent increase. Use Contribution Income Statements and What-If Sensitivity Analysis as a guide. Assume that two- thirds of fixed costs are manufacturing related; the remaining one-third are selling-related. The variable manufacturing cost per unit is $30, while the variable selling cost per unit is $5. (Hint: Calculate the DOL for 2022 at a sales volume of 2,400 units.) (Input your answer as a percentage rounded to 2 decimal places (i.e., 0.1567 = 15.67%).) Show less A DOL % What If Gaming Table Cost Data Contribution Income Statements Required 1 Required 2 Sensitivity Analysis Using the spreadsheet you created, compute the new operating profit assuming a 10% decrease in demand. Operating profit Required: 1. Using the data from 2022 in Gaming Table Cost Data, create an Excel spreadsheet to provide a sensitivity analysis of the effect on operating profit of potential changes in demand for HFI Incorporated, ranging from a 20 percent decrease to a 20 percent increase. Use Contribution Income Statements and What-If Sensitivity Analysis as a guide. Assume that two-thirds of fixed costs are manufacturing related; the remaining one-third are selling-related. The variable manufacturing cost per unit is $30, while the variable selling cost per unit is $5. (Hint: Calculate the DOL for 2022 at a sales volume of 2,400 units.) 2. Using the spreadsheet you created, compute the new operating profit assuming a 10% decrease in demand. Complete this question by entering your answers in the tabs below. Gaming Table Contribution Income Statements What If Sensitivity Analysis Required 1 Required 2 Cost Data Per Unit 2022 69,000 Fixed costs (per year) Selling price Variable cost Planned production Planned sales volume $ 75 35 $ 2,400 units 2,400 units 2023 $ 69,000 2,600 units 2,600 units Contribution Income Statements Gaming Table Cost Data Sales Variable costs Total contribution margin Fixed costs Operating profit What If Sensitivity Analysis Amount $ $ $ 2022 180,000 84,000 96,000 60,000 36,000 Required 1 Percent 100.00 % $ 46.67 53.33 % $ $ Required 2 Amount 2023 195,000 91,000 104,000 60,000 44,000 Percent 100.00 % $ 46.67 53.33 % $ $ Change Notes 15,000 7,000 8,000 53.33% is the contribution margin ratio 0 8,000 $8,000=0.5333 * $15,000 Gaming Table Cost Data Units Sold 1,500 1,500 1,500 1,500 Contribution Income Statements Variable Cost per Unit $ What If Sensitivity Analysis Fixed Costs 30 $ 35 40 45 69,000 69,000 69,000 69,000 Required 1 Selling Price per Unit $ Required 2 75 75 75 75 Operating Profit $ 7,500 0 -7,500 -15,000 What If Gaming Table Cost Data Contribution Income Statements Required 1 Required 2 Sensitivity Analysis Using the data from 2022 in Gaming Table Cost Data, create an Excel spreadsheet to provide a sensitivity analysis of the effect on operating profit of potential changes in demand for HFI Incorporated, ranging from a 20 percent decrease to a 20 percent increase. Use Contribution Income Statements and What-If Sensitivity Analysis as a guide. Assume that two- thirds of fixed costs are manufacturing related; the remaining one-third are selling-related. The variable manufacturing cost per unit is $30, while the variable selling cost per unit is $5. (Hint: Calculate the DOL for 2022 at a sales volume of 2,400 units.) (Input your answer as a percentage rounded to 2 decimal places (i.e., 0.1567 = 15.67%).) Show less A DOL % What If Gaming Table Cost Data Contribution Income Statements Required 1 Required 2 Sensitivity Analysis Using the spreadsheet you created, compute the new operating profit assuming a 10% decrease in demand. Operating profit