

Question
Required: (a) Comment on ROE and ROCE for Dominos Pizza and Woolworths from 2015 to 2019 using DuPont analysis framework. (7 marks) (b) Using the
Required:
(a) Comment on ROE and ROCE for Dominos Pizza and Woolworths from 2015 to 2019 using DuPont analysis framework. (7 marks)
(b) Using the selected numbers from the tables, discuss how do Dominos Pizza and Woolworths generate profits differently based on the nature and strategy of the business. (3 marks)
(c) Using the selected numbers from the tables, discuss which company is risker. (4 marks)
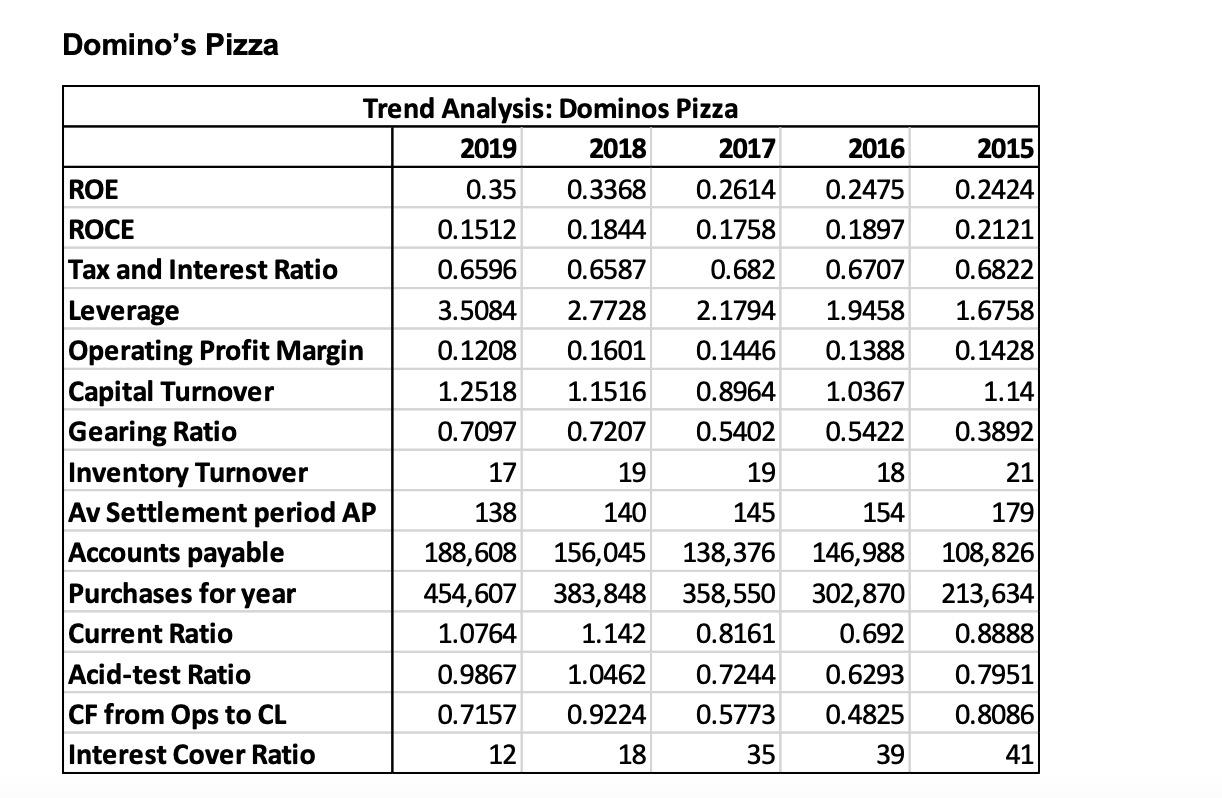
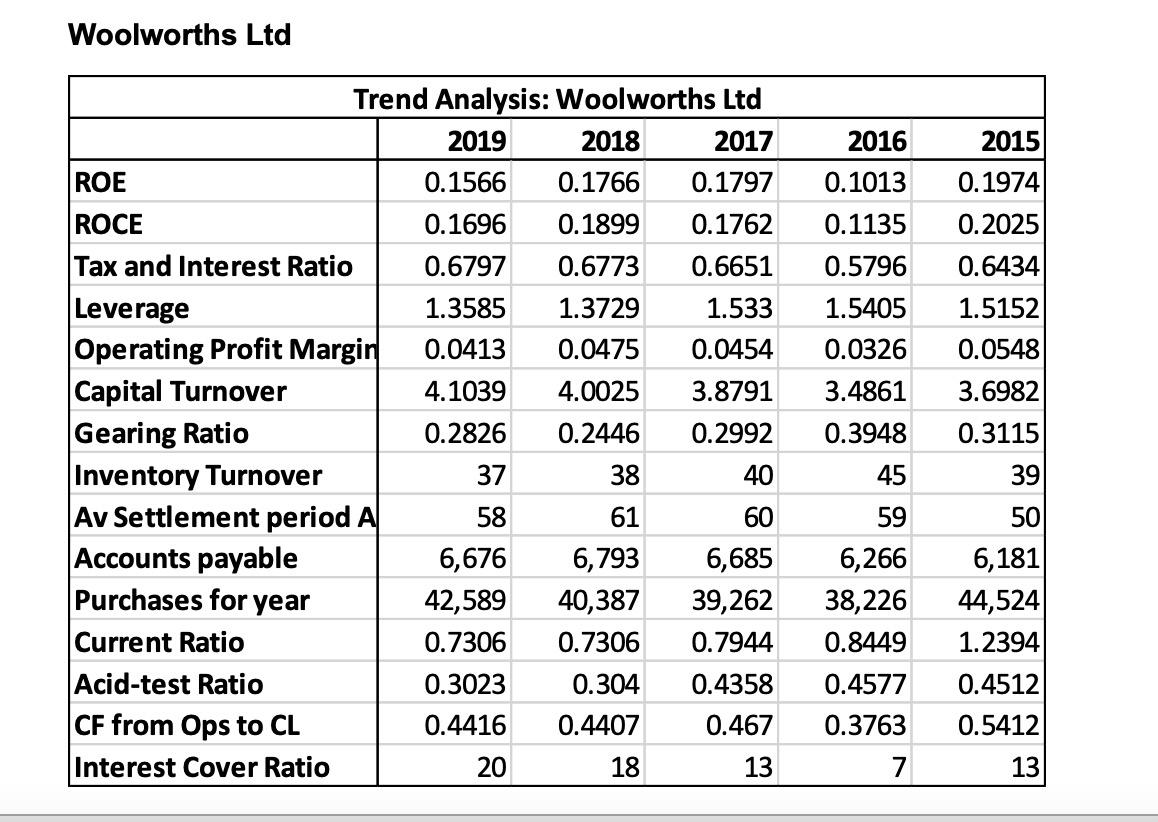
Domino's Pizza Trend Analysis: Dominos Pizza 2019 2018 2017 2015 ROE 0.2614 0.2424 0.35 0.1512 0.6596 0.3368 0.1844 ROCE 0.1758 2016 0.2475 0.1897 0.6707 1.9458 0.2121 0.6587 0.6822 3.5084 2.7728 0.1601 1.1516 0.682 2.1794 0.1446 0.8964 1.6758 0.1428 0.1388 1.14 0.1208 1.2518 0.7097 17 1.0367 0.5422 0.7207 0.5402 0.3892 19 19 18 21 Tax and Interest Ratio Leverage Operating Profit Margin Capital Turnover Gearing Ratio Inventory Turnover Av Settlement period AP Accounts payable Purchases for year Current Ratio Acid-test Ratio CF from Ops to CL Interest Cover Ratio 138 188,608 454,607 1.0764 0.9867 0.7157 140 145 156,045 138,376 383,848 358,550 1.142 0.8161 1.0462 0.7244 0.9224 0.5773 18 35 154 179 146,988 108,826 302,870 213,634 0.692 0.8888 0.6293 0.7951 0.4825 0.8086 39 41 12 Woolworths Ltd 2016 2015 Trend Analysis: Woolworths Ltd 2019 2018 2017 ROE 0.1566 0.1766 0.1797 ROCE 0.1696 0.1899 0.1762 Tax and Interest Ratio 0.6797 0.6773 0.6651 Leverage 1.3585 1.3729 1.533 Operating Profit Margin 0.0413 0.0475 0.0454 Capital Turnover 4.1039 4.0025 3.8791 Gearing Ratio 0.2826 0.2446 0.2992 Inventory Turnover 37 38 40 Av Settlement period A 58 61 60 Accounts payable 6,676 6,793 6,685 Purchases for year 42,589 40,387 39,262 Current Ratio 0.7306 0.7306 0.7944 Acid-test Ratio 0.3023 0.304 0.4358 CF from Ops to CL 0.4416 0.4407 0.467 Interest Cover Ratio 20 18 13 0.1013 0.1135 0.5796 1.5405 0.0326 3.4861 0.3948 0.1974 0.2025 0.6434 1.5152 0.0548 3.6982 0.3115 39 50 6,181 44,524 1.2394 0.4512 0.5412 45 59 6,266 38,226 0.8449 0.4577 0.3763 7 13Step by Step Solution
There are 3 Steps involved in it
Step: 1

Get Instant Access to Expert-Tailored Solutions
See step-by-step solutions with expert insights and AI powered tools for academic success
Step: 2

Step: 3
Ace Your Homework with AI
Get the answers you need in no time with our AI-driven, step-by-step assistance
Get Started
Auditing and Assurance Services A Systematic Approach
Authors: William Messier, Steven Glover, Douglas Prawitt
9th edition
1308361491, 77862333, 978-1259248290, 9780077862336, 1259162346, 978-1259162343