Answered step by step
Verified Expert Solution
Link Copied!

Question

1 Approved Answer

Required: a) Te fookie corp has created the following x-bar 5 PC report to analyze the diameter (in millimeters) of their cookies, Review the results

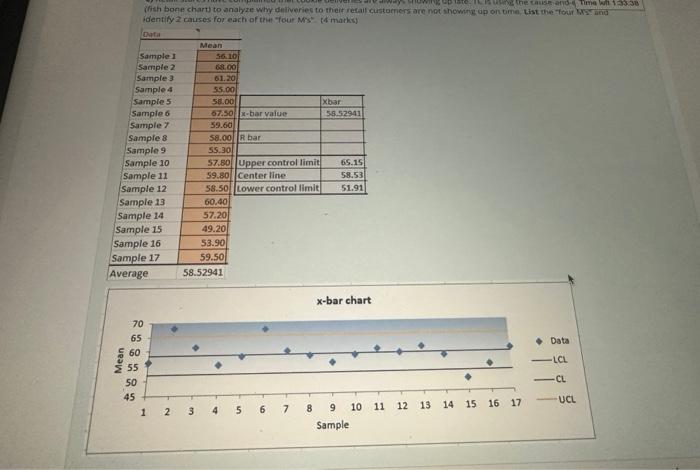
image text in transcribed
Required: a) Te fookie corp has created the following x-bar 5 PC report to analyze the diameter (in millimeters) of their cookies, Review the results and provide a brief, professionally written ouragtaph to management discussing the following: - conclusions drawn from the SPC charts. - two possible causes of points outside the control limits You can assume all data points were within the upper and lower control limits from a Range perspective. (5 marks) b) TC Cookie Corp. also has a retail store attached to the front of the manufacturing plant to sell their freshly baked cookies. Service productivity has been low, in part because of customer involvement in the design or delivery of the service. The textbook outines ways to design more efficlent services, Choose-one and explain how TC Cookie Corp. can use it to increase service efficiency. (2 marks) c) Retail stores have complained that cookie deliveries are always showing up late. TC is using the cause-and-effect diagram identily 2 causes for each of thit four Mis' (4) marks) batal \begin{tabular}{|c|c|c|c|} \hline & Mean & & \\ \hline Sample 1 & 56.10 & & \\ \hline Sample 2 & 6800 & & \\ \hline Sample 3 & 01.20 & & \\ \hline Sample 4 & 5.5,00 & & \\ \hline Samples & 58.00 & & Xbar: \\ \hline Sample 6 & 67.50 & x-bar value & 58.52941 \\ \hline Sample 7 & 59.60 & & \\ \hline Sample 8 & 58.00 & Rbar: & \\ \hline Sample 9 & 55.30 & & \\ \hline Sample 10 & 57.50 & Upper control limit & 65.15 \\ \hline Sample 11 & 59.80 & Center line & 58.53 \\ \hline Sample 12 & 58.50 & Lower control limit & 51.91 \\ \hline Sample 13 & 60.40 & \multirow{6}{*}{ : } & \\ \hline Sample 14 & 57.20 & & \\ \hline Sample 15 & 49.20 & & \\ \hline Sample 16 & 53.90 & & \\ \hline Sample 17 & 59.50 & & \\ \hline Average & 58.52941 & & \\ \hline \end{tabular} x-bar chart Sample

Step by Step Solution

There are 3 Steps involved in it

Step: 1

blur-text-image

Get Instant Access to Expert-Tailored Solutions

See step-by-step solutions with expert insights and AI powered tools for academic success

Step: 2

blur-text-image

Step: 3

blur-text-image

Ace Your Homework with AI

Get the answers you need in no time with our AI-driven, step-by-step assistance

Get Started

Recommended Textbook for

Introduction To Management In The Hospitality Industry

Authors: Clayton W Barrows, Tom Powers

7th Edition

9780471782766

More Books

Students also viewed these General Management questions

Question

Describe the process and objectives of bankruptcy

Answered: 1 week ago