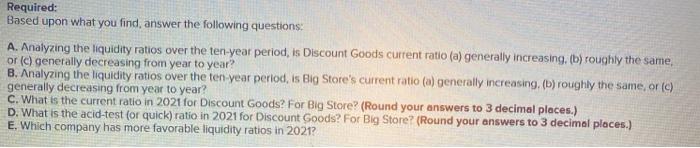
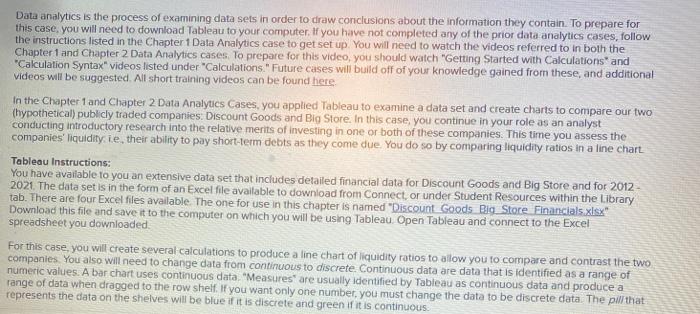
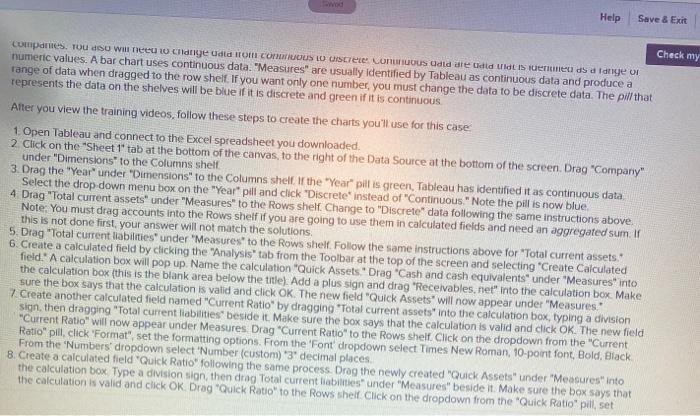
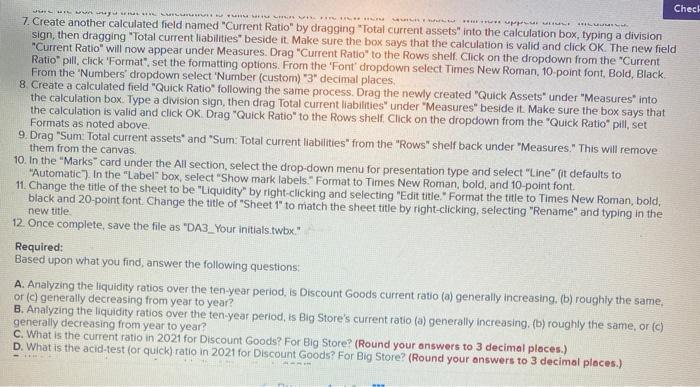
Required: Based upon what you find answer the following questions: A. Analyzing the liquidity ratios over the ten-year period, is Discount Goods current ratio (a) generally increasing, (b) roughly the same, or (c) generally decreasing from year to year? 8. Analyzing the liquidity ratios over the ten year period, is Big Store's current ratio (a) generally increasing, (b) roughly the same, or (c) generally decreasing from year to year? C. What is the current ratio in 2021 for Discount Goods? For Big Store? (Round your answers to 3 decimal places.) D. What is the acid-test (or quick) ratio in 2021 for Discount Goods? For Big Store? (Round your answers to 3 decimal places.) E. Which company has more favorable liquidity ratios in 2021? Data analytics is the process of examining data sets in order to draw conclusions about the information they contain. To prepare for this case, you will need to download Tableau to your computer. If you have not completed any of the prior data analytics cases, follow the instructions listed in the Chapter 1 Data Analytics case to get set up. You will need to watch the videos referred to in both the Chapter 1 and Chapter 2 Data Analytics cases. To prepare for this video, you should watch "Getting Started with Calculations and Calculation Syntax" videos listed under "Calculations." Future cases will build off of your knowledge gained from these, and additional videos will be suggested. All short training videos can be found here In the Chapter 1 and Chapter 2 Data Analytics Cases, you applied Tableau to examine a data set and create charts to compare our two (hypothetical) publicly traded companies, Discount Goods and Big Store. In this case, you continue in your role as an analyst conducting introductory research into the relative merits of investing in one or both of these companies. This time you assess the companies' liquidity.ie, their ability to pay short-term debts as they come due. You do so by comparing liquidity ratios in a line chart Tableau Instructions: You have available to you an extensive data set that includes detailed financial data for Discount Goods and Big Store and for 2012 2021. The data set is in the form of an Excel file available to download from Connect, or under Student Resources within the Library tab. There are four Excel files available. The one for use in this chapter is named "Discount Goods Big Store Financials xlsx" Download this file and save it to the computer on which you will be using Tableau Open Tableau and connect to the Excel spreadsheet you downloaded For this case, you will create several calculations to produce a line chart of liquidity ratios to allow you to compare and contrast the two companies. You also will need to change data from continuous to discrete Continuous data are data that is identified as a range of numeric values. A barchart uses continuous data, "Measures are usually identified by Tableau as continuous data and produce a range of data when dragged to the row shelf. If you want only one number, you must change the data to be discrete data. The pill that represents the data on the shelves will be blue if it is discrete and green if it is continuous. Help Save & Exit Check my "Compane. Tu su will need to change udid on COUDUS LO CISCTE LOUS Odld ale Udidlas med as a lange on numeric values. A bar chart uses continuous data. "Measures are usually identified by Tableau as continuous data and produce a range of data when dragged to the row shelf. If you want only one number, you must change the data to be discrete data. The pill that represents the data on the shelves will be blue if it is discrete and green if it is continuous After you view the training videos, follow these steps to create the charts you'll use for this case 1. Open Tableau and connect to the Excel spreadsheet you downloaded. 2 Click on the "Sheet 1" tab at the bottom of the canvas, to the right of the Data Source at the bottom of the screen Drag "Company" under "Dimensions to the Columns shell 3. Drag the "Year" under "Dimensions to the Columns shelf If the Year" pilis green, Tableau has identified it as continuous data Select the drop down menu box on the "Year" pill and click "Discrete instead of "Continuous." Note the pill is now blue 4 Drag "Total current assets under "Measures to the Rows shelf. Change to "Discrete data following the same instructions above Note: You must drag accounts into the Rows shelf if you are going to use them in calculated fields and need an aggregated sum in this is not done first, your answer will not match the solutions 5. Drag "Total current liabilities under "Measures to the Rows shelf. Follow the same instructions above for "Total current assets. 6. Create a calculated field by clicking the "Analysis tab from the Toolbar at the top of the screen and selecting 'Create Calculated field" A calculation box will pop up. Name the calculation "Quick Assets. Drag "Cash and cash equivalents under "Measures into the calculation box (this is the blank area below the title). Add a plus sign and drag "Receivables, net into the calculation box Make sure the box says that the calculation is valid and click OK. The new field "Quick Assets will now appear under "Measures 7. Create another calculated field named "Current Ratio" by dragging "Total current assets" into the calculation box, typing a division sign, then dragging "Total current liabilities beside it. Make sure the box says that the calculation is valid and click OK. The new field "Current Ratio" will now appear under Measures Drag "Current Ratio" to the Rows shelf. Click on the dropdown from the "Current Ratio" pill, click 'Format", set the formatting options. From the 'Font dropdown select Times New Roman, 10-point font, Bold, Black From the 'Numbers' dropdown select 'Number custom) "3" decimal places 8. Create a calculated field "Quick Ratio" following the same process. Drag the newly created "Quick Assets" under "Measures into the calculation box Type a division sion, then drag Total current liabilities under "Measures" beside it. Make sure the box says that the calculation is valid and click OK Drag Quick Ratio to the Rows shell. Click on the dropdown from the "Quick Ratio" pill, set www. Chech . ***HELL 7. Create another calculated field named "Current Ratio" by dragging "Total current assets" into the calculation box, typing a division sign, then dragging "Total current liabilities" beside it. Make sure the box says that the calculation is valid and click OK. The new field "Current Ratio" will now appear under Measures. Drag "Current Ratio" to the Rows shelf. Click on the dropdown from the "Current Ratio" pill. click 'Format". set the formatting options. From the 'Font dropdown select Times New Roman, 10-point font, Bold, Black From the 'Numbers' dropdown select 'Number (Custom) "3" decimal places 8. Create a calculated field "Quick Ratio" following the same process. Drag the newly created "Quick Assets under "Measures into the calculation box. Type a division sign, then drag Total current liabilities under "Measures" beside it. Make sure the box says that the calculation is valid and click OK. Drag "Quick Ratio" to the Rows shelf. Click on the dropdown from the "Quick Ratio" pill, set Formats as noted above. 9. Drag "Sum: Total current assets" and "Sum: Total current liabilities from the "Rows" shelf back under "Measures." This will remove them from the canvas. 10. In the "Marks" card under the All section, select the drop-down menu for presentation type and select "Line" fit defaults to "Automatic"). In the "Label" box, select "Show mark labels." Format to Times New Roman, bold, and 10-point font. 11. Change the title of the sheet to be "Liquidity" by right-clicking and selecting "Edit title."Format the title to Times New Roman, bold, black and 20-point font Change the title of "Sheet 1" to match the sheet title by right-clicking, selecting "Rename" and typing in the new title 12. Once complete, save the file as "DA3_Your initials.twbx." Required: Based upon what you find, answer the following questions A. Analyzing the liquidity ratios over the ten-year period, is Discount Goods current ratio (a) generally increasing. (b) roughly the same, or generally decreasing from year to year? B. Analyzing the liquidity ratios over the ten-year period, is Big Store's current ratio (a) generally increasing, (b) roughly the same, or (c) generally decreasing from year to year? C. What is the current ratio in 2021 for Discount Goods? For Big Store? (Round your answers to 3 decimal places.) D. What is the acid-test (or quick) ratio in 2021 for Discount Goods? For Big Store? (Round your answers to 3 decimal places.) Required: Based upon what you find answer the following questions: A. Analyzing the liquidity ratios over the ten-year period, is Discount Goods current ratio (a) generally increasing, (b) roughly the same, or (c) generally decreasing from year to year? 8. Analyzing the liquidity ratios over the ten year period, is Big Store's current ratio (a) generally increasing, (b) roughly the same, or (c) generally decreasing from year to year? C. What is the current ratio in 2021 for Discount Goods? For Big Store? (Round your answers to 3 decimal places.) D. What is the acid-test (or quick) ratio in 2021 for Discount Goods? For Big Store? (Round your answers to 3 decimal places.) E. Which company has more favorable liquidity ratios in 2021? Data analytics is the process of examining data sets in order to draw conclusions about the information they contain. To prepare for this case, you will need to download Tableau to your computer. If you have not completed any of the prior data analytics cases, follow the instructions listed in the Chapter 1 Data Analytics case to get set up. You will need to watch the videos referred to in both the Chapter 1 and Chapter 2 Data Analytics cases. To prepare for this video, you should watch "Getting Started with Calculations and Calculation Syntax" videos listed under "Calculations." Future cases will build off of your knowledge gained from these, and additional videos will be suggested. All short training videos can be found here In the Chapter 1 and Chapter 2 Data Analytics Cases, you applied Tableau to examine a data set and create charts to compare our two (hypothetical) publicly traded companies, Discount Goods and Big Store. In this case, you continue in your role as an analyst conducting introductory research into the relative merits of investing in one or both of these companies. This time you assess the companies' liquidity.ie, their ability to pay short-term debts as they come due. You do so by comparing liquidity ratios in a line chart Tableau Instructions: You have available to you an extensive data set that includes detailed financial data for Discount Goods and Big Store and for 2012 2021. The data set is in the form of an Excel file available to download from Connect, or under Student Resources within the Library tab. There are four Excel files available. The one for use in this chapter is named "Discount Goods Big Store Financials xlsx" Download this file and save it to the computer on which you will be using Tableau Open Tableau and connect to the Excel spreadsheet you downloaded For this case, you will create several calculations to produce a line chart of liquidity ratios to allow you to compare and contrast the two companies. You also will need to change data from continuous to discrete Continuous data are data that is identified as a range of numeric values. A barchart uses continuous data, "Measures are usually identified by Tableau as continuous data and produce a range of data when dragged to the row shelf. If you want only one number, you must change the data to be discrete data. The pill that represents the data on the shelves will be blue if it is discrete and green if it is continuous. Help Save & Exit Check my "Compane. Tu su will need to change udid on COUDUS LO CISCTE LOUS Odld ale Udidlas med as a lange on numeric values. A bar chart uses continuous data. "Measures are usually identified by Tableau as continuous data and produce a range of data when dragged to the row shelf. If you want only one number, you must change the data to be discrete data. The pill that represents the data on the shelves will be blue if it is discrete and green if it is continuous After you view the training videos, follow these steps to create the charts you'll use for this case 1. Open Tableau and connect to the Excel spreadsheet you downloaded. 2 Click on the "Sheet 1" tab at the bottom of the canvas, to the right of the Data Source at the bottom of the screen Drag "Company" under "Dimensions to the Columns shell 3. Drag the "Year" under "Dimensions to the Columns shelf If the Year" pilis green, Tableau has identified it as continuous data Select the drop down menu box on the "Year" pill and click "Discrete instead of "Continuous." Note the pill is now blue 4 Drag "Total current assets under "Measures to the Rows shelf. Change to "Discrete data following the same instructions above Note: You must drag accounts into the Rows shelf if you are going to use them in calculated fields and need an aggregated sum in this is not done first, your answer will not match the solutions 5. Drag "Total current liabilities under "Measures to the Rows shelf. Follow the same instructions above for "Total current assets. 6. Create a calculated field by clicking the "Analysis tab from the Toolbar at the top of the screen and selecting 'Create Calculated field" A calculation box will pop up. Name the calculation "Quick Assets. Drag "Cash and cash equivalents under "Measures into the calculation box (this is the blank area below the title). Add a plus sign and drag "Receivables, net into the calculation box Make sure the box says that the calculation is valid and click OK. The new field "Quick Assets will now appear under "Measures 7. Create another calculated field named "Current Ratio" by dragging "Total current assets" into the calculation box, typing a division sign, then dragging "Total current liabilities beside it. Make sure the box says that the calculation is valid and click OK. The new field "Current Ratio" will now appear under Measures Drag "Current Ratio" to the Rows shelf. Click on the dropdown from the "Current Ratio" pill, click 'Format", set the formatting options. From the 'Font dropdown select Times New Roman, 10-point font, Bold, Black From the 'Numbers' dropdown select 'Number custom) "3" decimal places 8. Create a calculated field "Quick Ratio" following the same process. Drag the newly created "Quick Assets" under "Measures into the calculation box Type a division sion, then drag Total current liabilities under "Measures" beside it. Make sure the box says that the calculation is valid and click OK Drag Quick Ratio to the Rows shell. Click on the dropdown from the "Quick Ratio" pill, set www. Chech . ***HELL 7. Create another calculated field named "Current Ratio" by dragging "Total current assets" into the calculation box, typing a division sign, then dragging "Total current liabilities" beside it. Make sure the box says that the calculation is valid and click OK. The new field "Current Ratio" will now appear under Measures. Drag "Current Ratio" to the Rows shelf. Click on the dropdown from the "Current Ratio" pill. click 'Format". set the formatting options. From the 'Font dropdown select Times New Roman, 10-point font, Bold, Black From the 'Numbers' dropdown select 'Number (Custom) "3" decimal places 8. Create a calculated field "Quick Ratio" following the same process. Drag the newly created "Quick Assets under "Measures into the calculation box. Type a division sign, then drag Total current liabilities under "Measures" beside it. Make sure the box says that the calculation is valid and click OK. Drag "Quick Ratio" to the Rows shelf. Click on the dropdown from the "Quick Ratio" pill, set Formats as noted above. 9. Drag "Sum: Total current assets" and "Sum: Total current liabilities from the "Rows" shelf back under "Measures." This will remove them from the canvas. 10. In the "Marks" card under the All section, select the drop-down menu for presentation type and select "Line" fit defaults to "Automatic"). In the "Label" box, select "Show mark labels." Format to Times New Roman, bold, and 10-point font. 11. Change the title of the sheet to be "Liquidity" by right-clicking and selecting "Edit title."Format the title to Times New Roman, bold, black and 20-point font Change the title of "Sheet 1" to match the sheet title by right-clicking, selecting "Rename" and typing in the new title 12. Once complete, save the file as "DA3_Your initials.twbx." Required: Based upon what you find, answer the following questions A. Analyzing the liquidity ratios over the ten-year period, is Discount Goods current ratio (a) generally increasing. (b) roughly the same, or generally decreasing from year to year? B. Analyzing the liquidity ratios over the ten-year period, is Big Store's current ratio (a) generally increasing, (b) roughly the same, or (c) generally decreasing from year to year? C. What is the current ratio in 2021 for Discount Goods? For Big Store? (Round your answers to 3 decimal places.) D. What is the acid-test (or quick) ratio in 2021 for Discount Goods? For Big Store? (Round your answers to 3 decimal places.)