Required
-
Compute the values of each of the ratios in Exhibit 5.26 for Walmart for 2020. Walmart had 2,821 million common shares outstanding at the end of fiscal 2020, and the market price per share was $140.49. For 2019, the comparable shares and price per share were 2,832 million and $114.49, and for 2018, they were 2,878 million and $95.83, respectively. Notes: For days accounts receivable outstanding, use total revenues in your calculations. For computations with interest expense, exclude interest income but include imputed interest expense on average operating lease liabilities (current and long-term); Walmart discloses an implicit interest rate of 6.1% on operating leases. For the interest coverage ratio (cash flow basis), ignore imputed interest for operating leases (as done in the text). For earnings before interest and taxes in the Altmans Z calculation, include interest income in earnings before interest and taxes.
-
Interpret the changes in Walmarts risk ratios during the three-year period, indicating any areas of concern.
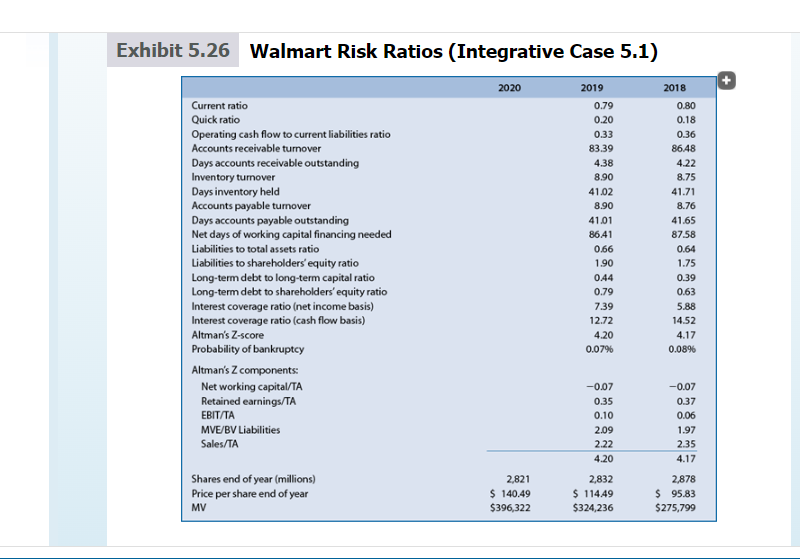
Exhibit 5.26 Walmart Risk Ratios (Integrative Case 5.1) 2020 Current ratio Quick ratio Operating cash flow to current liabilities ratio Accounts receivable turnover Days accounts receivable outstanding Inventory turnover Days inventory held Accounts payable turnover Days accounts payable outstanding Net days of working capital financing needed Liabilities to total assets ratio Liabilities to shareholders' equity ratio Long-term debt to long-term capital ratio Long-term debt to shareholders' equity ratio Interest coverage ratio (net income basis) Interest coverage ratio (cash flow basis) Altman's Z-score Probability of bankruptcy Altman's Z components: Net working capital/TA Retained earnings/TA EBIT/TA MVE/BV Liabilities Sales/TA 2019 0.79 0.20 0.33 83.39 4.38 8.90 41.02 8.90 41.01 86.41 0.66 1.90 0.44 0.79 7.39 12.72 4.20 0.0796 2018 0.80 0.18 0.36 86.48 4.22 8.75 41.71 8.76 41.65 87.58 0.64 1.75 0.39 0.63 5.88 14.52 4.17 0.0896 -0.07 0.35 0.10 2.09 2.22 4.20 -0.07 0.37 0.06 1.97 2.35 4.17 Shares end of year (millions) Price per share end of year MV 2,821 $ 140.49 $396,322 2,832 $ 11449 $324,236 2,878 $ 95.83 $275,799 Exhibit 5.26 Walmart Risk Ratios (Integrative Case 5.1) 2020 Current ratio Quick ratio Operating cash flow to current liabilities ratio Accounts receivable turnover Days accounts receivable outstanding Inventory turnover Days inventory held Accounts payable turnover Days accounts payable outstanding Net days of working capital financing needed Liabilities to total assets ratio Liabilities to shareholders' equity ratio Long-term debt to long-term capital ratio Long-term debt to shareholders' equity ratio Interest coverage ratio (net income basis) Interest coverage ratio (cash flow basis) Altman's Z-score Probability of bankruptcy Altman's Z components: Net working capital/TA Retained earnings/TA EBIT/TA MVE/BV Liabilities Sales/TA 2019 0.79 0.20 0.33 83.39 4.38 8.90 41.02 8.90 41.01 86.41 0.66 1.90 0.44 0.79 7.39 12.72 4.20 0.0796 2018 0.80 0.18 0.36 86.48 4.22 8.75 41.71 8.76 41.65 87.58 0.64 1.75 0.39 0.63 5.88 14.52 4.17 0.0896 -0.07 0.35 0.10 2.09 2.22 4.20 -0.07 0.37 0.06 1.97 2.35 4.17 Shares end of year (millions) Price per share end of year MV 2,821 $ 140.49 $396,322 2,832 $ 11449 $324,236 2,878 $ 95.83 $275,799