

Answered step by step
Verified Expert Solution
Question
1 Approved Answer
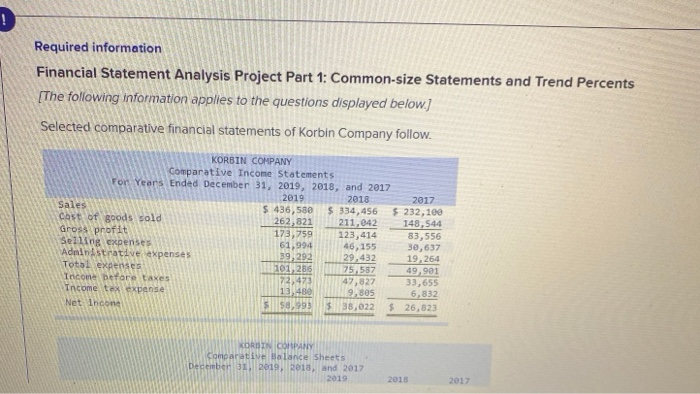
Required information Financial Statement Analysis Project Part 1: Common-size Statements and Trend Percents [The following information applies to the questions displayed below.) Selected comparative financial
Step by Step Solution
There are 3 Steps involved in it
Step: 1

Get Instant Access to Expert-Tailored Solutions
See step-by-step solutions with expert insights and AI powered tools for academic success
Step: 2

Step: 3
Ace Your Homework with AI
Get the answers you need in no time with our AI-driven, step-by-step assistance
Get Started
Auditing Transformation Regulation Digitalisation And Sustainability
Authors: Jan Marton, Fredrik Nilsson, Peter Öhman
1st Edition
103253303X, 978-1032533032