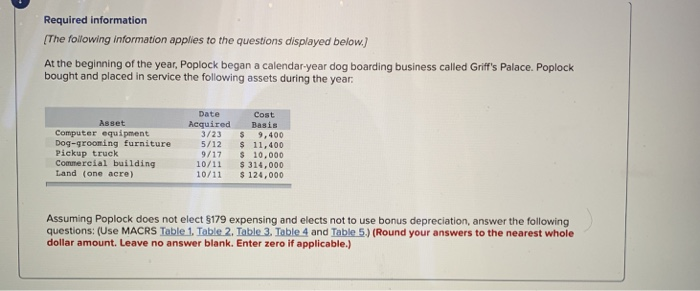
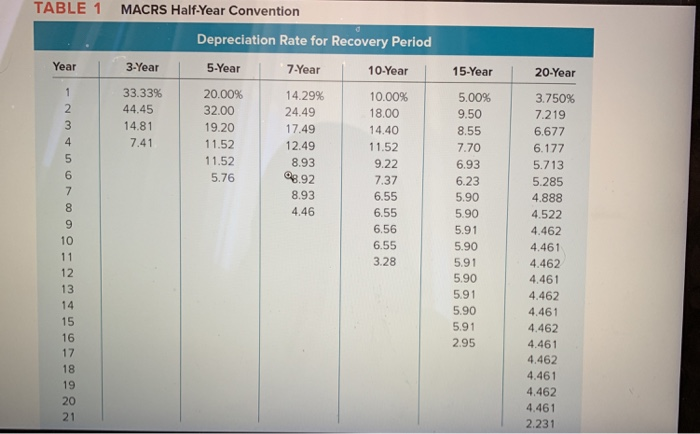
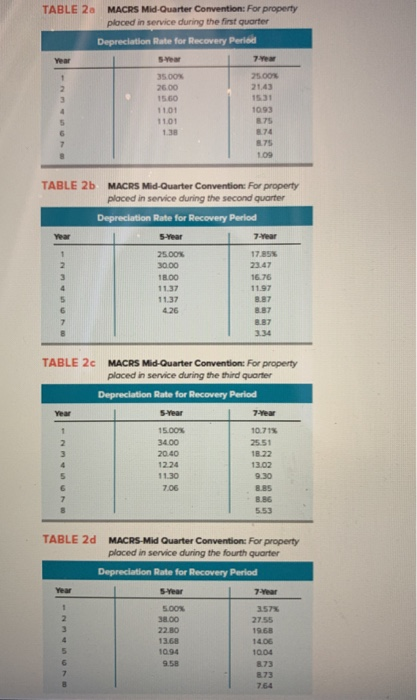
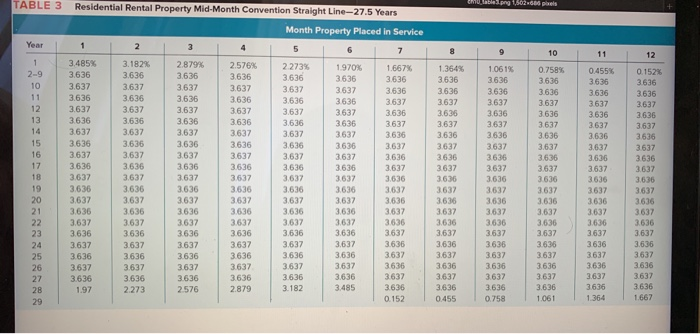
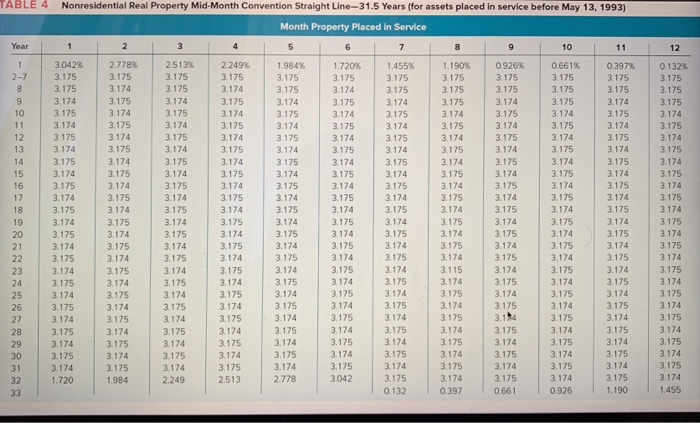
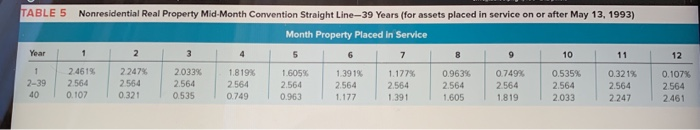
Required information (The foilowing information applies to the questions displayed below.) At the beginning of the year, Poplock began a calendar-year dog boarding business called Griff's Palace. Poplock bought and placed in service the following assets during the year Date Cost Basis Asset Acquired Computer equipment Dog-grooming furniture Pickup truck Commercial building Land (one acre) 3/23 $ 9,400 5/12 9/17 10,000 10/11 $ 314,000 10/11 124,000 Assuming Poplock does not elect $179 expensing and elects not to use bonus depreciation, answer the following questions: (Use MACRS Table 1. Table 2. Table 3. Table 4 and Table 5.) (Round your answers to the nearest whole dollar amount. Leave no answer blank. Enter zero if applicable.) TABLE 1 MACRS Half Year Convention Depreciation Rate for Recovery Period 20-Year 5-Year 15-Year 7-Year 10-Year 3-Year Year 3750% 7.219 6.677 33.33% 44.45 14.81 7.41 20.00% 32.00 19.20 11.52 11.52 5.76 10.00% 18.00 4.40 11.52 9.22 7.37 6.55 6.55 6.56 6.55 3.28 5.00% 9.50 8.55 7.70 6.93 6.23 5.90 5.90 5.91 5.90 5.91 5.90 5.91 5.90 5.91 2.95 14.29% 24.49 17.49 12.49 8.93 08.92 8.93 4.46 5.713 5.285 4.888 4.522 4.462 4.461 4.462 4.461 4.462 4.461 4.462 4.461 4.462 4.461 4.462 4.461 2.231 5 6 8 9 10 12 13 15 19 20 TABLE 2a MACRS Mid-Quarter Comvention: For property ploced in service duning the first quarter Depreclation Rate for Recovery Perid 7-Year s-year 3500% 26.00 15.60 11.01 11.01 21.43 15.31 1093 875 874 875 109 1.38 TABLE 2b MACRS Mid-Quarter Convention: For property placed in service during the second quarter Depreclation Rate for Recovery Period 17B5% 23.47 6.76 11.97 30.00 1B.OO 11.37 11.37 4.26 8.87 3.34 TABLE 2c MACRS Mid-Quarter Convention: For property placed in service duning the third quarter Depreciation Rate for Recovery Period -year 1 500% 10.71% 2551 1224 11.30 7.06 13.02 9.30 8.85 5.53 TABLE 2d MACRS-Mid Quarter Convention: For property placed in service duning the fourth quarter Depreclation Rate for Recovery Period 7-Year 157% 27.55 1968 14.06 1004 873 873 7.64 22.80 13.68 10.94 9.58 TABLE 3 Residential Rental Property Mid-Month Convention Straight Line-27.5 Years Month Property Placed in Service 10 3 485% 3.636 3.637 3.182% 2.879% 3.636 3.637 2.576% 3.636 3.637 3636 3.637 3636 2 273% 1970% 1.667% 3.636 3.636 3.637 3636 3637 636 1.364% | 1.061% 3.636 0.758% 3.636 3.636 3637 3.636 3.637 0455% | 0.152% 3.636 3636 3636 10 3.637 3.636 3.637 3.637 3636 3.637 .636 3637 3.636 3.637 3637 3.637 3.636 3.637 3.636 3.637 3.637 .636 3.636 3.636 3637 3.637 3.636 3.637 3636 3637 3.637 3.637 3636 3637 3636 3.637 3.636 3.637 3.636 18 19 20 3.637 3.636 3.637 3.637 3.636 3636 3.636 3.637 3.636 3.637 3.636 3.637 3.636 3.636 3636 3637 3636 3.636 3637 3.636 3637 3636 3637 3636 3.636 3.637 3.636 3.637 3.637 3.636 3.637 3.636 3636 3.637 3.636 3.637 3.636 0455 3637 3636 3637 3636 3.637 3636 2576 25 3.636 3.637 3.636 2.273 3.637 3636 2.879 3.636 3.637 3.637 3.636 3637 3636 1667 3.636 3.485 27 28 29 3636 0.758 1061 TABLE 4 Nonresidential Real Property Mid-Month Convention Straight Line-31.5 Years (for assets placed in service before May 13, 1993) Month Property Placed in Service 3.042% 2.778% 3.175 3.174 2.513% 1.720% | 1.455% 3.175 2249% 1.984% 3.175 1.190% 10.926% 0.661% | 0397% | 0.132% 3.175 3.174 3.175 3.175 3.174 3.175 3.174 3.175 3.174 3.175 3.175 3.175 3.174 3.175 3.174 3.175 3.174 3.175 3.174 3.174 3.175 3.174 3.175 3.174 3.175 3.174 3.175 3.174 12 14 16 3174 3.174 3.175 3.174 3.175 3.175 3.174 3.174 3.175 3.174 3.175 3.174 3.175 3.174 3.175 3.175 3.174 3.174 3.175 3.174 3.175 3.174 3.174 3.174 3.175 3.174 3.175 3.174 3.175 3.174 3.175 3.174 3.175 3.174 3.175 3.174 3.175 3.174 3.174 3.174 3.174 3.175 19 20 3.174 3.175 3.174 3.175 3.174 3.175 3.174 3.174 3.175 3.174 3.175 3.174 3.174 3.175 3.174 3.174 3.174 3.174 3.174 3.175 3.174 3.174 3.175 3.174 3.175 3.174 3.174 25 26 3.174 3.174 3.175 3.174 3.174 3.175 3.174 3.174 3.175 3.174 3.175 3.175 3.174 3.175 3.174 1.455 3.175 30 3.175 3.174 3.174 2.249 3.174 3.175 32 0.397 0.926 TABLE 5 Nonresidential Real Property Mid-Month Convention Straight Line-39 Years (for assets placed in service on or after May 13, 1993) Month Property Placed in Service Year 10 12 2461% | 2247% | 2033% | 1.819% | 155% 1.391% 2.564 1.177% 2.564 1.391 0.963% 2.564 1,605 0.749% 2564 1819 0.535% 2.564 2.033 0.321% 2.564 2247 0.107% 2.564 2.461 2-39 2 564 40 2 564 0.321 2.564 0.535 2 564 0.749 2.564 0.963 0.107 Required information (The foilowing information applies to the questions displayed below.) At the beginning of the year, Poplock began a calendar-year dog boarding business called Griff's Palace. Poplock bought and placed in service the following assets during the year Date Cost Basis Asset Acquired Computer equipment Dog-grooming furniture Pickup truck Commercial building Land (one acre) 3/23 $ 9,400 5/12 9/17 10,000 10/11 $ 314,000 10/11 124,000 Assuming Poplock does not elect $179 expensing and elects not to use bonus depreciation, answer the following questions: (Use MACRS Table 1. Table 2. Table 3. Table 4 and Table 5.) (Round your answers to the nearest whole dollar amount. Leave no answer blank. Enter zero if applicable.) TABLE 1 MACRS Half Year Convention Depreciation Rate for Recovery Period 20-Year 5-Year 15-Year 7-Year 10-Year 3-Year Year 3750% 7.219 6.677 33.33% 44.45 14.81 7.41 20.00% 32.00 19.20 11.52 11.52 5.76 10.00% 18.00 4.40 11.52 9.22 7.37 6.55 6.55 6.56 6.55 3.28 5.00% 9.50 8.55 7.70 6.93 6.23 5.90 5.90 5.91 5.90 5.91 5.90 5.91 5.90 5.91 2.95 14.29% 24.49 17.49 12.49 8.93 08.92 8.93 4.46 5.713 5.285 4.888 4.522 4.462 4.461 4.462 4.461 4.462 4.461 4.462 4.461 4.462 4.461 4.462 4.461 2.231 5 6 8 9 10 12 13 15 19 20 TABLE 2a MACRS Mid-Quarter Comvention: For property ploced in service duning the first quarter Depreclation Rate for Recovery Perid 7-Year s-year 3500% 26.00 15.60 11.01 11.01 21.43 15.31 1093 875 874 875 109 1.38 TABLE 2b MACRS Mid-Quarter Convention: For property placed in service during the second quarter Depreclation Rate for Recovery Period 17B5% 23.47 6.76 11.97 30.00 1B.OO 11.37 11.37 4.26 8.87 3.34 TABLE 2c MACRS Mid-Quarter Convention: For property placed in service duning the third quarter Depreciation Rate for Recovery Period -year 1 500% 10.71% 2551 1224 11.30 7.06 13.02 9.30 8.85 5.53 TABLE 2d MACRS-Mid Quarter Convention: For property placed in service duning the fourth quarter Depreclation Rate for Recovery Period 7-Year 157% 27.55 1968 14.06 1004 873 873 7.64 22.80 13.68 10.94 9.58 TABLE 3 Residential Rental Property Mid-Month Convention Straight Line-27.5 Years Month Property Placed in Service 10 3 485% 3.636 3.637 3.182% 2.879% 3.636 3.637 2.576% 3.636 3.637 3636 3.637 3636 2 273% 1970% 1.667% 3.636 3.636 3.637 3636 3637 636 1.364% | 1.061% 3.636 0.758% 3.636 3.636 3637 3.636 3.637 0455% | 0.152% 3.636 3636 3636 10 3.637 3.636 3.637 3.637 3636 3.637 .636 3637 3.636 3.637 3637 3.637 3.636 3.637 3.636 3.637 3.637 .636 3.636 3.636 3637 3.637 3.636 3.637 3636 3637 3.637 3.637 3636 3637 3636 3.637 3.636 3.637 3.636 18 19 20 3.637 3.636 3.637 3.637 3.636 3636 3.636 3.637 3.636 3.637 3.636 3.637 3.636 3.636 3636 3637 3636 3.636 3637 3.636 3637 3636 3637 3636 3.636 3.637 3.636 3.637 3.637 3.636 3.637 3.636 3636 3.637 3.636 3.637 3.636 0455 3637 3636 3637 3636 3.637 3636 2576 25 3.636 3.637 3.636 2.273 3.637 3636 2.879 3.636 3.637 3.637 3.636 3637 3636 1667 3.636 3.485 27 28 29 3636 0.758 1061 TABLE 4 Nonresidential Real Property Mid-Month Convention Straight Line-31.5 Years (for assets placed in service before May 13, 1993) Month Property Placed in Service 3.042% 2.778% 3.175 3.174 2.513% 1.720% | 1.455% 3.175 2249% 1.984% 3.175 1.190% 10.926% 0.661% | 0397% | 0.132% 3.175 3.174 3.175 3.175 3.174 3.175 3.174 3.175 3.174 3.175 3.175 3.175 3.174 3.175 3.174 3.175 3.174 3.175 3.174 3.174 3.175 3.174 3.175 3.174 3.175 3.174 3.175 3.174 12 14 16 3174 3.174 3.175 3.174 3.175 3.175 3.174 3.174 3.175 3.174 3.175 3.174 3.175 3.174 3.175 3.175 3.174 3.174 3.175 3.174 3.175 3.174 3.174 3.174 3.175 3.174 3.175 3.174 3.175 3.174 3.175 3.174 3.175 3.174 3.175 3.174 3.175 3.174 3.174 3.174 3.174 3.175 19 20 3.174 3.175 3.174 3.175 3.174 3.175 3.174 3.174 3.175 3.174 3.175 3.174 3.174 3.175 3.174 3.174 3.174 3.174 3.174 3.175 3.174 3.174 3.175 3.174 3.175 3.174 3.174 25 26 3.174 3.174 3.175 3.174 3.174 3.175 3.174 3.174 3.175 3.174 3.175 3.175 3.174 3.175 3.174 1.455 3.175 30 3.175 3.174 3.174 2.249 3.174 3.175 32 0.397 0.926 TABLE 5 Nonresidential Real Property Mid-Month Convention Straight Line-39 Years (for assets placed in service on or after May 13, 1993) Month Property Placed in Service Year 10 12 2461% | 2247% | 2033% | 1.819% | 155% 1.391% 2.564 1.177% 2.564 1.391 0.963% 2.564 1,605 0.749% 2564 1819 0.535% 2.564 2.033 0.321% 2.564 2247 0.107% 2.564 2.461 2-39 2 564 40 2 564 0.321 2.564 0.535 2 564 0.749 2.564 0.963 0.107