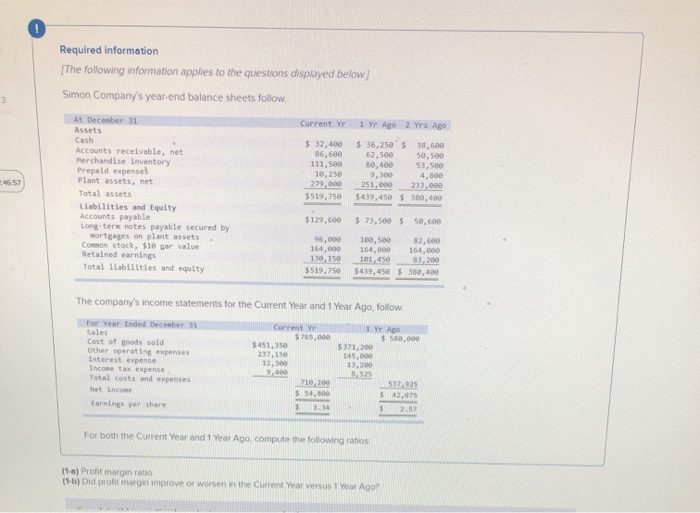
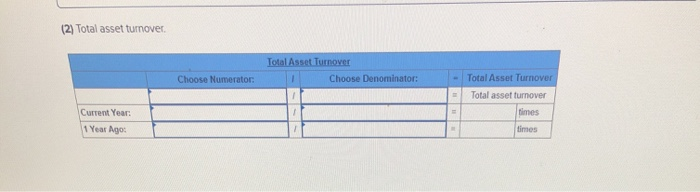
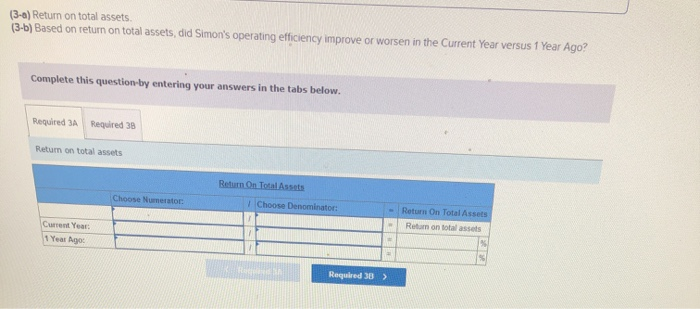
Required information The following information applies to the questions displayed below. Simon Company's year-end balance sheets follow Current Yel Yr Ago 2 Yrs Ago At December 31 Assets Cash Accounts receivable, net Merchandise Inventory Prepaid expenset Plant assets, net Total assets abilities and Equity Accounts payable Long-term notes payable secured by sortates on plant assets Common stock, $10 bar value Retained earnings Total liabilities and equity $ 32,400 86,600 111,500 10,250 279,000 $519,250 36,250 62,500 30,400 9,300 251,000 $419,450 $ 38,500 50.500 53,500 4.800 233,000 $350,400 $129.600 $ 73,500 $ 50,600 96,000 164,000 130,150 5519,750 100,500 $2,600 164,000 160, 101.450 1.200 $439,450 $350,400 The company's income statements for the Current Year and 1 Year Ago follow. 5765,000 $ 580,000 $371.200 For Year Ended December 31 Sales Cost of goods sold Other operating expenses Interest expense Income tax expense Total costs and expenses Net Income $451,350 237,150 12,300 145,00 18,525 710,200 1537,925 Earnings per share For both the Current Year and 1 Year Ago, compute the following ratios (1-0) Profit margin ratio (1.b) Did profit margin improve or worsen in the Current Year versus 1 Year Ago? (1-a) Profit margin ratio 11-b) Did profit margin improve or worsen in the Current Year versus 1 Year Ago? Complete this question by entering your answers in the tabs below. Required LA Required 10 Profit margin ratio Prof Margin Ratio Choose Denominator Choose Numerator: - Profit Margin Ratio C | YAH. 1 Year Ago Required 18 > (1-a) Profit margin ratio. (1-b) Did profit margin improve or worsen in the Current Year versus 1 Year Ago? Complete this question by entering your answers in the tabs below. Required 1A Required 1B Did profit margin improve or worsen in the Current Year versus 1 Year Ago? Profit margin