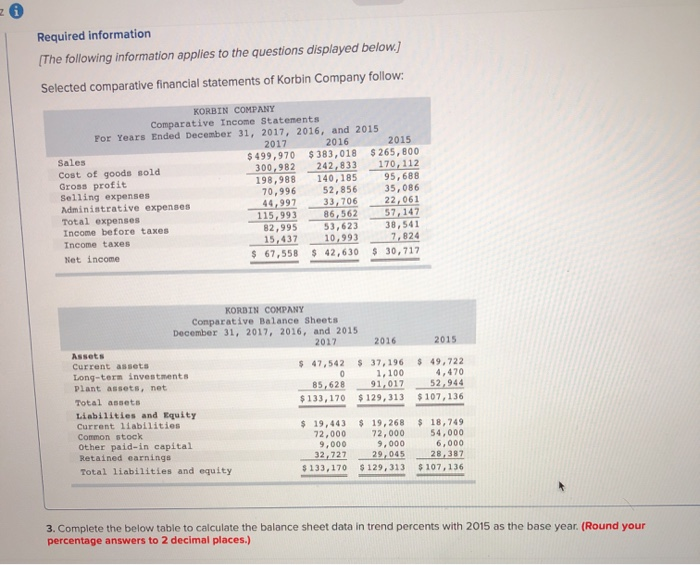
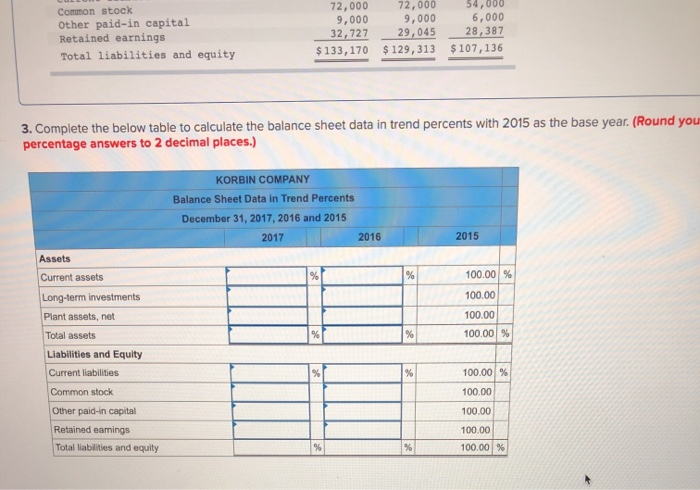
Required information [The following information applies to the questions displayed below.) Selected comparative financial statements of Korbin Company follow: KORBIN COMPANY Comparative Income Statements For Years Ended December 31, 2017, 2016, and 2015 2017 2016 2015 Sales $ 499,970 $ 383,018 $ 265,800 Cost of goods sold 300,982 242,833 170,112 Gross profit 198,988 140,185 95,688 Selling expenses 70,996 52,856 35,086 Administrative expenses 44,997 33,706 22,061 Total expenses 115,993 86,562 57, 147 Income befor taxes 82,995 53,623 38,541 Income taxes 15,437 10,993 7,824 Net income $ 67,558 $ 42,630 $ 30,717 2015 KORBIN COMPANY Comparative Balance Sheets December 31, 2017, 2016, and 2015 2017 2016 Assets Current assets $ 47,542 $ 37, 196 Long-term investments 0 1,100 Plant assets, net 85,628 91.017 Total assets $133, 170 $ 129,313 Liabilities and Equity Current liabilities $ 19,443 $ 19,268 Common stock 72,000 72,000 Other paid-in capital 9,000 9,000 Retained earnings 32,227 29.045 Total liabilities and equity $ 133,170 $ 129,313 $ 49,722 4.470 52,944 $ 107, 136 $ 18,749 54,000 6,000 28,387 $ 107,136 3. Complete the below table to calculate the balance sheet data in trend percents with 2015 as the base year. (Round your percentage answers to 2 decimal places.) Common stock Other paid-in capital Retained earnings Total liabilities and equity 72,000 72,000 54,000 9,000 9,000 6,000 32,727 29,045 28,387 $ 133,170 $129,313 $107,136 3. Complete the below table to calculate the balance sheet data in trend percents with 2015 as the base year. (Round you percentage answers to 2 decimal places.) KORBIN COMPANY Balance Sheet Data in Trend Percents December 31, 2017, 2016 and 2015 2017 2016 2015 Assets % % 100.00 % 100.00 Current assets Long-term investments Plant assets, net Total assets Liabilities and Equity Current liabilities 100.00 100.00 % % % % 100.00 % Common stock 100.00 100.00 Other paid-in capital Retained eamings Total liabilities and equity 100.00 100.00 % %