

Answered step by step
Verified Expert Solution
Question
1 Approved Answer
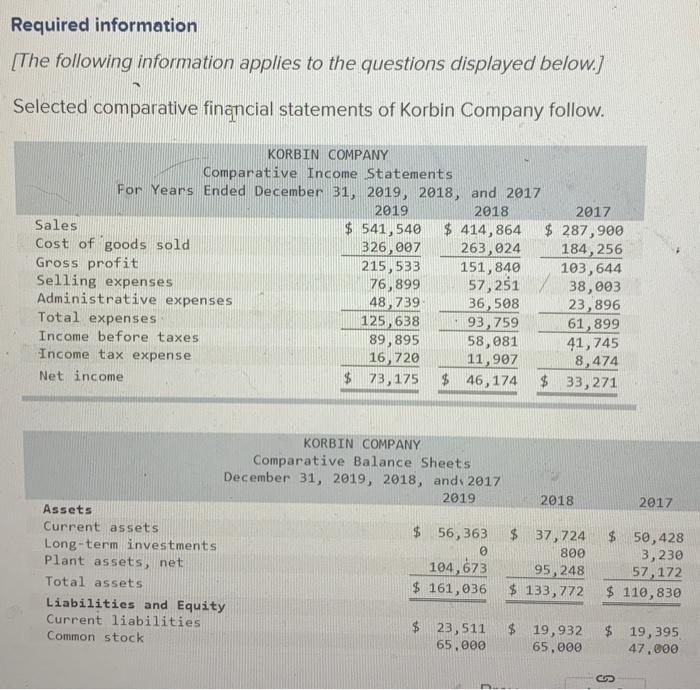
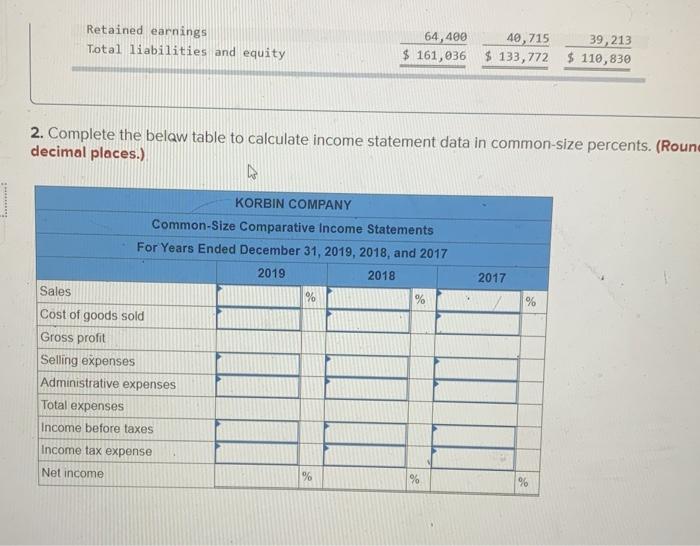
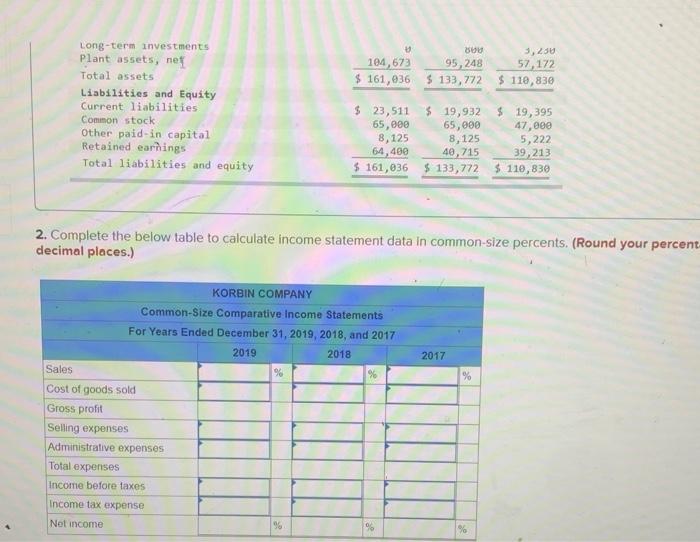
Required information [The following information applies to the questions displayed below.] Selected comparative financial statements of Korbin Company follow. KORBIN COMPANY Comparative Income Statements For
Step by Step Solution
There are 3 Steps involved in it
Step: 1

Get Instant Access to Expert-Tailored Solutions
See step-by-step solutions with expert insights and AI powered tools for academic success
Step: 2

Step: 3
Ace Your Homework with AI
Get the answers you need in no time with our AI-driven, step-by-step assistance
Get Started
Just Leave Me Alone Audit Clerk Knows What To Do Blank Lined Journal Funny Auditor Gifts For Women Men Funny Gift For Auditor Fun Finance Gifts An Auditor Who Loves Accounting And Auditing
Authors: Awesome Auditor
1st Edition
1659112699, 978-1659112696