

Answered step by step
Verified Expert Solution
Question
1 Approved Answer
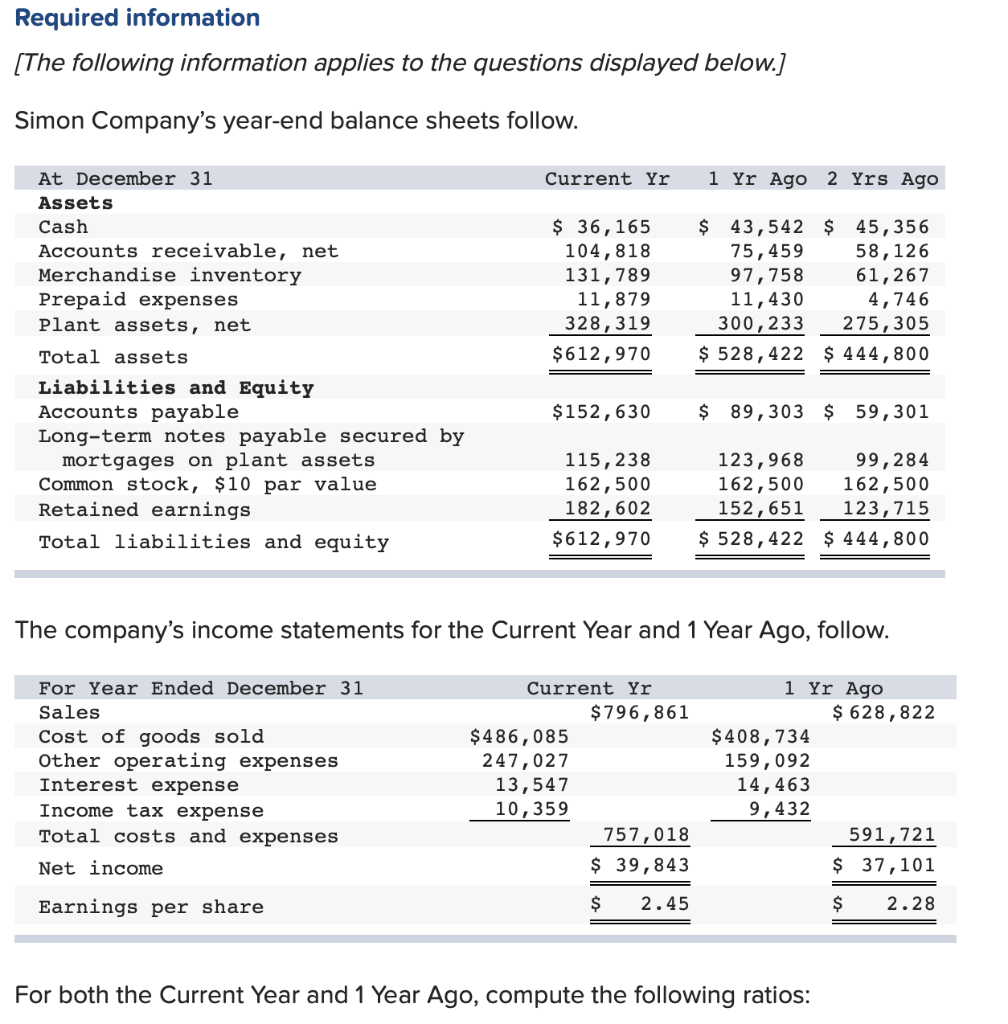
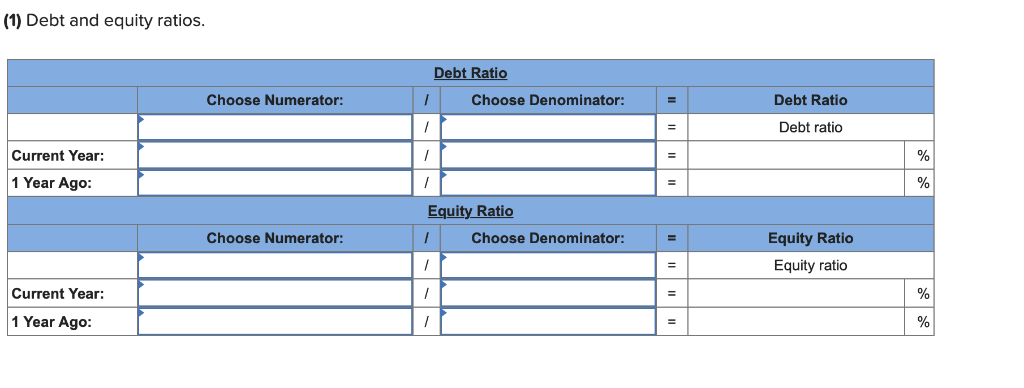
Required information [The following information applies to the questions displayed below.) Simon Company's year-end balance sheets follow. Current Yr1 Yr Ago 2 Yrs Ago At
Step by Step Solution
There are 3 Steps involved in it
Step: 1

Get Instant Access to Expert-Tailored Solutions
See step-by-step solutions with expert insights and AI powered tools for academic success
Step: 2

Step: 3
Ace Your Homework with AI
Get the answers you need in no time with our AI-driven, step-by-step assistance
Get Started
Loose Leaf For Financial Accounting Fundamentals
Authors: John Wild, Ken Shaw, Barbara Chiappetta
6th Edition
1260151980, 978-1260151985