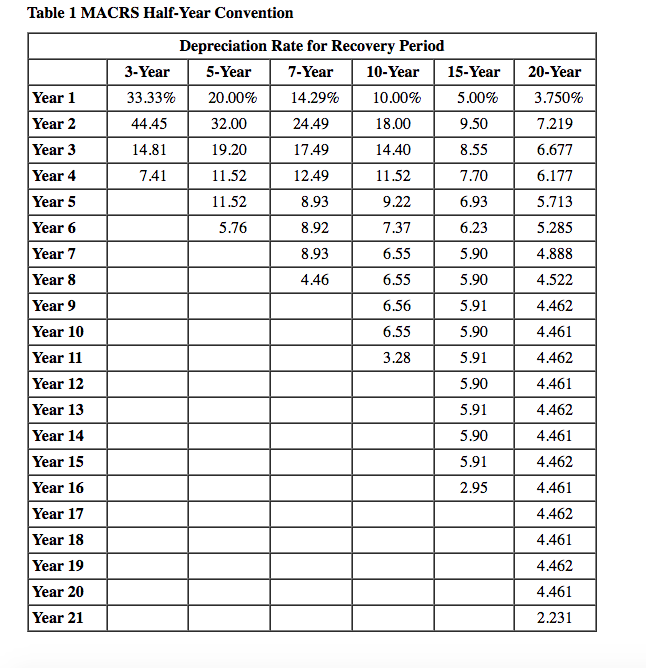
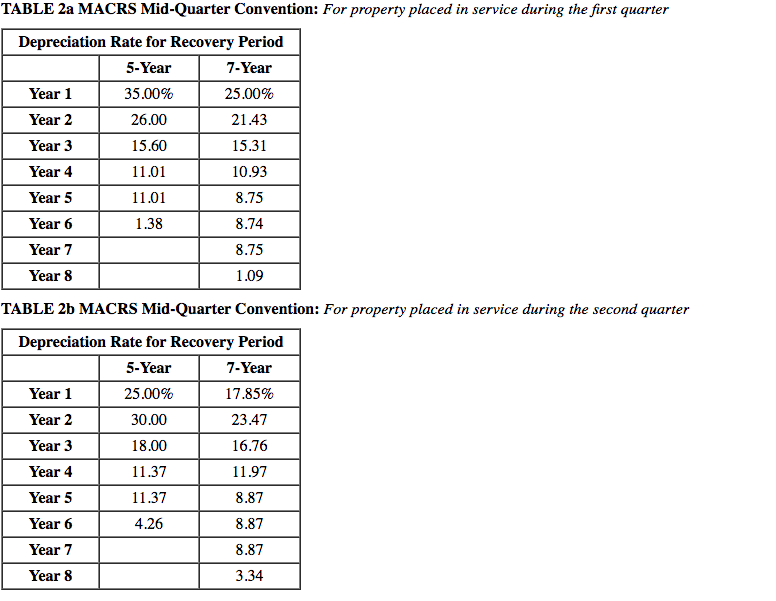
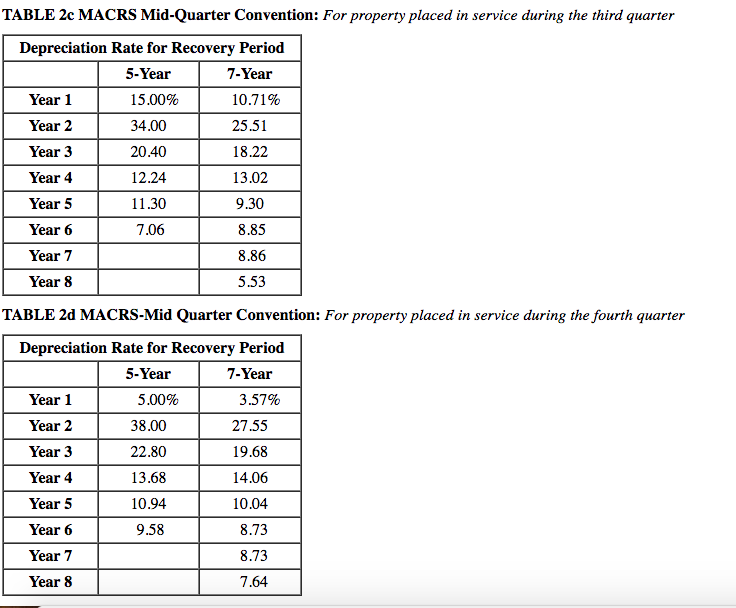
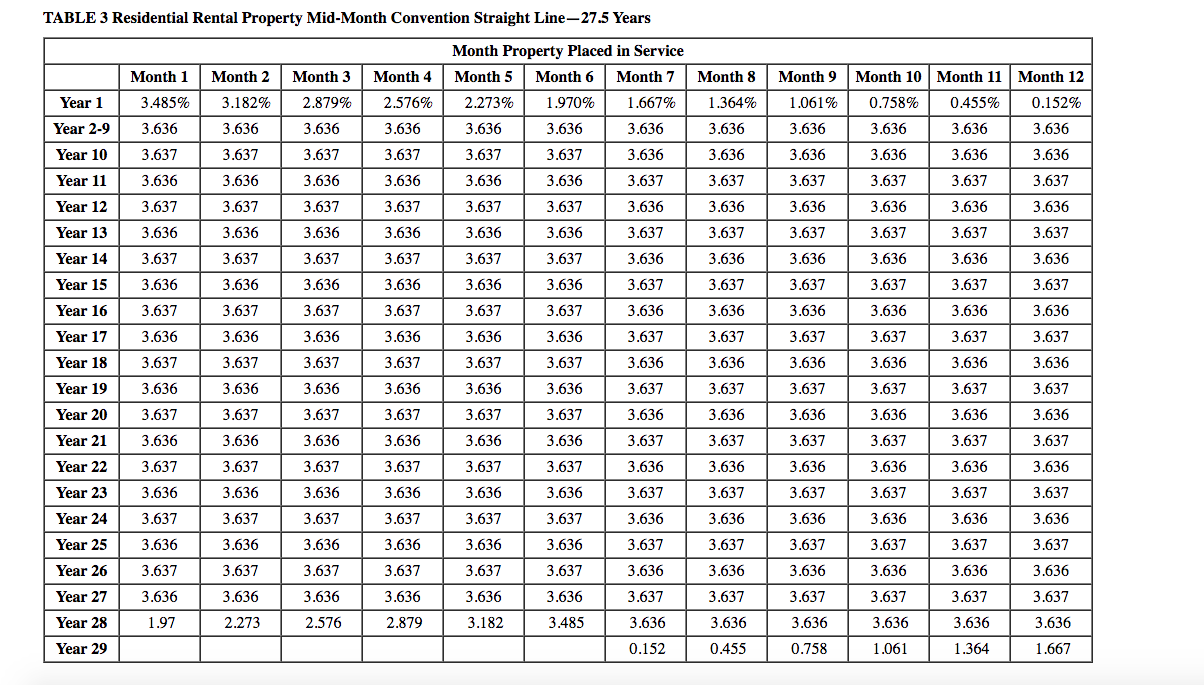
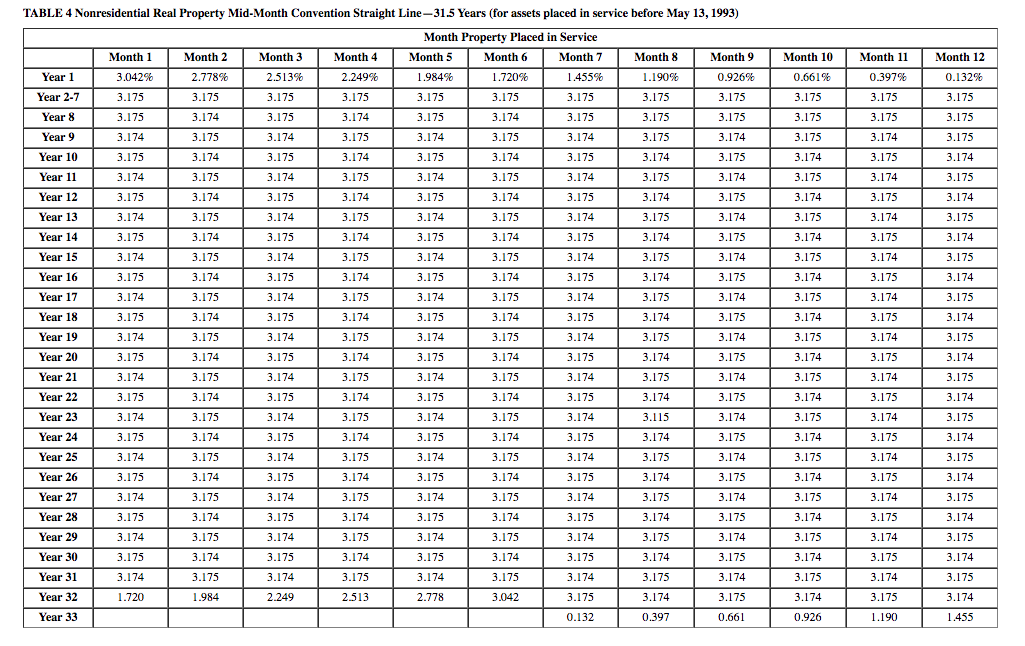
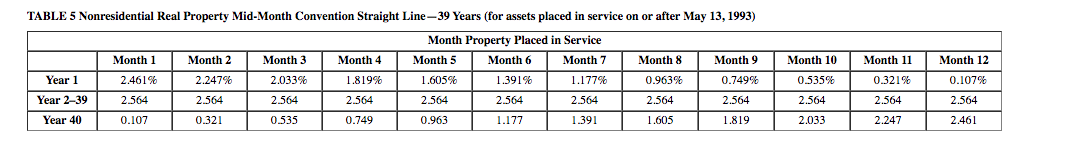
Required information [The following information applies to the questions displayed below.) AMP Corporation (calendar-year-end) has 2019 taxable income of $1,900,000 for purposes of computing the $179 expense. During 2019, AMP acquired the following assets: (Use MACRS Table 1, Table 2, Table 3, Table 4 and Table 5.) Asset Machinery Computer equipment Office building Total Placed in Service September 12 February 10 April 2 Basis $1,420,000 430,000 545,000 $2,395,000 a. What is the maximum amount of $179 expense AMP may deduct for 2019? Maximum $179 expense deductible Required information [The following information applies to the questions displayed below.] AMP Corporation (calendar-year-end) has 2019 taxable income of $1,900,000 for purposes of computing the $179 expense. During 2019, AMP acquired the following assets: (Use MACRS Table 1, Table 2. Table 3, Table 4 and Table 5.) Asset Machinery Computer equipment Office building Total Placed in Service September 12 February 10 April 2 Basis $1,420,000 430,000 545,000 $ 2,395,000 b. What is the maximum total depreciation, including $179 expense, that AMP may deduct in 2019 on the assets it placed in service in 2019, assuming no bonus depreciation? (Round your intermediate calculations to the nearest whole dollar amount.) Maximum total depreciation (including $179 expense) Table 1 MACRS Half-Year Convention | 3-Year 33.33% 44.45 14.81 7.41 20-Year 3.750% 7.219 6.677 6.177 5.713 5.285 4.888 4.522 Depreciation Rate for Recovery Period 5-Year 7-Year | 10-Year | 15-Year 20.00% 14.29% 10.00% 5.00% 32.00 24.49 18.00 9.50 19.20 17.49 14.40 8.55 11.52 12.49 11.52 7.70 11.52 8.93 9 .22 6.93 5.76 8.92 7.37 6.23 8.93 6.55 5.90 4.46 6.55 5.90 6.56 5.91 6.55 5.90 5.91 5.90 5.91 5.90 5.91 2.95 Year 1 Year 2 Year 3 Year 4 Year 5 Year 6 Year 7 Year 8 Year 9 Year 10 Year 11 Year 12 Year 13 Year 14 Year 15 Year 16 Year 17 Year 18 Year 19 Year 20 Year 21 4.462 3.28 4.461 4.462 4.461 4.462 4.461 4.462 4.461 4.462 4.461 4.462 4.461 2.231 TABLE 2a MACRS Mid-Quarter Convention: For property placed in service during the first quarter 1 Depreciation Rate for Recovery Period 5-Year 7-Year Year 1 35.00% 25.00% Year 2 26.00 21.43 Year 3 15.60 15.31 Year 4 11.01 10.93 Year 5 11.01 8.75 Year 6 1.38 8.74 Year 7 8.75 1 Year 8 1.09 TABLE 26 MACRS Mid-Quarter Convention: For property placed in service during the second quarter 1 Depreciation Rate for Recovery Period 5-Year 7-Year Year 1 25.00% 17.85% Year 2 30.00 23.47 Year 3 18.00 16.76 Year 4 11.37 11.97 Year 5 11.37 8.87 Year 6 4.26 8.87 Year 7 8.87 Year 8 3.34 TABLE 2c MACRS Mid-Quarter Convention: For property placed in service during the third quarter Depreciation Rate for Recovery Period 5-Year 7-Year Year 1 15.00% 10.71% Year 2 34.00 25.51 Year 3 20.40 18.22 Year 4 12.24 13.02 Year 5 11.30 9.30 Year 6 7.06 8.85 Year 7 8.86 Year 8 5.53 TABLE 20 MACRS-Mid Quarter Convention: For property placed in service during the fourth quarter | Depreciation Rate for Recovery Period 5-Year 7-Year Year 1 5.00% 3.57% | Year 2 38.00 27.55 Year 3 22.80 19.68 Year 4 13.68 14.06 Year 5 10.94 10.04 Year 6 9.58 8.73 Year 7 8.73 Year 8 7.64 TABLE 3 Residential Rental Property Mid-Month Convention Straight Line-27.5 Years Month Property Placed in Service Month 1 Month 2 Month 3 Month 4 Month 5 Month 6 Month 7 Month 8 Month 9 Month 10 Month 11 Month 12 Year 1 3.485% 3.182% 2.879% 2.576% 2.273% 1.970% 1.667% 1.364% 1.061% 0.758% 0.455% 0.152% Year 2-9 3.636 3.636 3.636 3.6363 .636 3.636 3.6363.636 L3.636 | 3.6363.636 3.636 Year 10 3.637 3.637 3.637 3 .637 3.637 | 3.637 3.636 | 3.636 3 .636 | 3.636 | 3.636 | 3.636 Year 11 3.636 3.636 3.636 3.636 3.636 3.636 3.6373.637 3.637 3.637 3.637 3.637 Year 12 3.637 3.6373.637 3.637 3.6373.637 3.6363.6363.6363.6363.6363.636 Year 13 3.636 3.636 3.636 3.636 3.636 3.636 3.637 3.637 3 .637 3.637 3.637 3.637 Year 14 3.637 3.637 3.637 3.637 3.637 3.637 3.636 3.636 3.636 3.636 3.636 Year 15 3.636 3.636 3.636 3.636 3.636 3.636 3.637 3.637 3.637 3.637 3.637 3.637 Year 163 .637 3.637 3.637 3.637 3.637 3 .637 3 .636 3.636 3.636 | 3.636 3.636 3.636 Year 17 3.636 | 3.636 3.636 3.636 3.636 | 3.636 | 3.637 3.637 3.637 3.637 3.637 Year 18 3.6373.637 3.637 3.6373.6373.637 3.6363.636 3.636 3.636 3.6363.636 Year 19 3.636 3.636 3.636 3.636 3.636 3.636 3.637 3.637 3.637 3.637 3.637 3.637 Year 20 3.637 3.637 3.637 3 .637 3.637 3.637 3.636 3.636 3 .636 3.636 3.636 3.636 Year 21 3.636 3.636 3.636 3.636 3.636 3.636 3.637 3.637 3 .637 3.637 3.637 3.637 Year 22 3.637 3.637 3.637 3.637 3.637 3.637 3.636 3.636 3.636 3.636 3.636 3.636 Year 23 3.636 3.636 3.636 3.636 3.636 3.636 3.637 3.637 3.637 3.637 3.637 3.637 Year 24 3.637 3.637 3.637 3.637 3.6373.637 3.636 3.636 3.636 3.636 3.636 3.636 Year 25 3.6363.6363.6363.6363.6363.636 3.637 3.637 3.637 3.6373.637 3.637 Year 26 | 3.637 | 3.637 | 3.637 | 3.637 | 3.637 | 3.637 3.636 | 3.636 3 .636 | 3.636 | 3.636 | 3.636 Year 27 3.636 3.636 3.636 3.636 3.636 3.636 3.637 3.637 3.637 3.637 3.637 3.637 Year 28 1.97 2.273 2.576 2.879 3.182 3.485 3.636 | 3.636 3.636 3.6363.6363.636 Year 29 0.152 0.455 0.758 1.061 1.364 1.667 TABLE 4 Nonresidential Real Property Mid-Month Convention Straight Line-31.5 Years (for assets placed in service before May 13, 1993) 1 Month 10 0.661% 3.175 Month 11 0.397% 3.175 1 3.175 3.175 Year 1 Year 2-7 Year 8 Year 9 Year 10 Year 11 Year 12 1 1 Year 13 Year 14 Year 15 Year 16 Year 17 Year 18 Year 19 Year 20 Year 21 Year 22 Year 23 Year 24 Month 1 3.042% 3.175 3.175 3.174 3.175 3.174 3.175 3.174 3.175 3.174 3.175 3.174 3.175 3.174 3.175 3.174 3.175 3.174 3.175 3.174 3.175 3.174 3.175 3.174 3.175 3.174 1.720 Month 2 2.778% 3.175 3.174 3.175 3.174 3.175 3.174 3.175 3.174 3.175 3.174 3.175 3.174 3.175 3.174 3.175 3.174 3.175 3.174 3.175 3.174 3.175 3.174 3.175 3.174 3.175 1.984 Month 3 2.513% 3.175 3.175 3.174 3.175 3.174 3.175 3.174 3.175 3.174 3.175 3.174 3.175 3.174 3.175 3.174 3.175 3.174 3.175 3.174 3.175 3.174 3.175 3.174 3.175 3.174 2.249 Month 4 2.249% 3.175 3.174 3.175 3.174 3.175 3.174 3.175 3.174 3.175 3.174 3.175 3.174 3.175 3.174 3.175 3.174 3.175 3.174 3.175 3.174 3.175 3.174 3.175 3.174 3.175 2.513 Month Property Placed in Service Month 5 Month 6 Month 7 1.984% 1.720% 1.455% 3.175 3.175 3.175 3.175 3.174 3.175 3.174 3.175 3.174 3.175 3.174 3.175 3.174 3.175 3.174 3.175 3.174 3.175 3.174 3.175 3.174 3.175 3.174 3.175 3.174 3.175 3.174 3.175 3.174 3.175 3.174 3.175 3.174 3.175 3.174 3.175 3.174 3.175 3.174 3.175 3.174 3.175 3.174 3.175 3.174 3.175 3.174 3.175 3.174 3.175 3.174 3.175 3.174 3.175 3.174 3.175 3.174 3.175 3.174 3.175 3.174 3.175 3.174 3.175 3.174 3.175 3.174 3.175 1 3.174 3.175 3.174 3.175 3.174 3.175 3.174 2.778 3.042 3.175 0.132 | Month 8 1.190% 3.175 3.175 3.175 3.174 3.175 3.174 3.175 3.174 3.175 3.174 3.175 3.174 3.175 3.174 3.175 3.174 3.115 3.174 3.175 3.174 3.175 3.174 3.175 3.174 3.175 3.174 0.397 Month 9 0.926% 3.175 3.175 3.174 3.175 3.174 3.175 3.174 3.175 3.174 3.175 3.174 3.175 3.174 3.175 3.174 3.175 3.174 3.175 3.174 3.175 3.174 3.175 3.174 3.175 3.175 3.174 3.175 0.661 3.175 3.174 3.175 3.174 3.175 3.174 3.175 3.174 3.175 3.174 3.175 3.174 3.175 3.174 3.175 3.174 3.175 3.174 3.175 3.174 3.175 3.174 3.175 3.174 0.926 3.174 3.175 3.174 3.175 3.174 3.175 3.174 3.175 3.174 3.175 3.174 3.175 3.174 3.175 3.174 3.175 3.174 3.175 3.174 3.175 3.174 3.175 3.174 3.175 1.190 Month 12 0.132% 3.175 3.175 3.175 3.174 3.175 3.174 3.175 3.174 3.175 3.174 3.175 3.174 3.175 3.174 3.175 3.174 3.175 3.174 3.175 3.174 3.175 3.174 3.175 3.174 3.175 3.174 1.455 1 Year 25 Year 26 Year 27 Year 28 Year 29 Year 30 Year 31 Year 32 Year 33 1 TABLE 5 Nonresidential Real Property Mid-Month Convention Straight Line-39 Years (for assets placed in service on or after May 13, 1993) Month Property Placed in Service Month 1 Month 2 Month 3 Month 4 Month 3 Month 6 Month 7 Month 8 Month 9 Year 1 2.461% 2.247% 2.033% 1.819% 1.605% 1.391% 1.177% 0.963% 0.749% Year 2-39 2.564 2.564 2.564 2.564 2.564 2.564 2.564 2.564 2.564 Year 400.107 10.321 0.535 10.749 10.963 ..1771 1.3911 1.605 11 .819 Month 10 Month 11 0.535% 0.321% 2.564 2.564 2.0332 .247 Month 12 0.107% 2.564 2.461