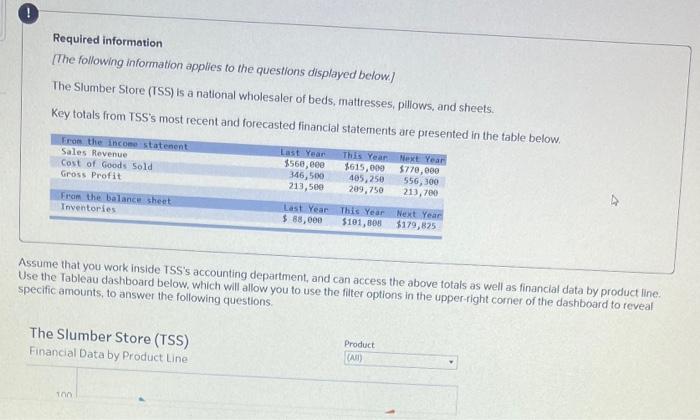
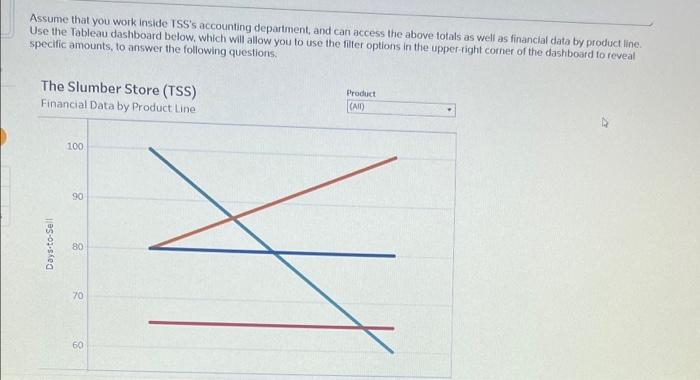
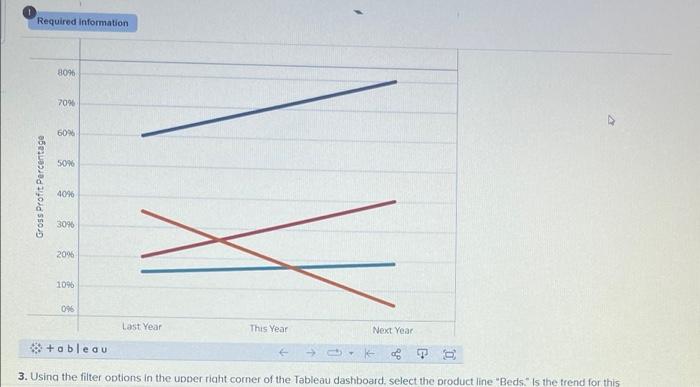
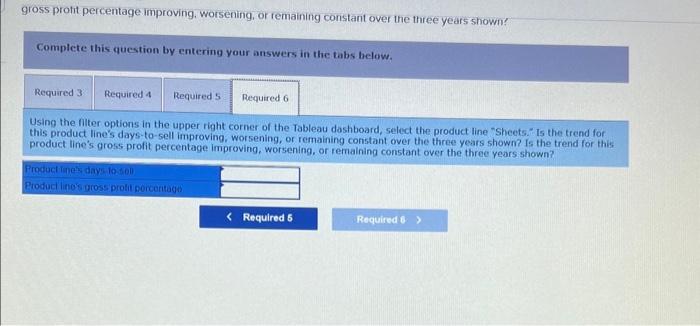
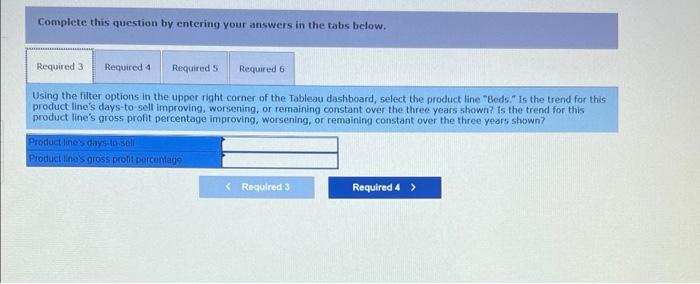
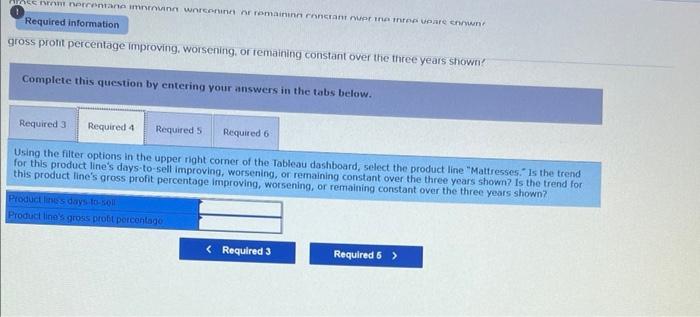
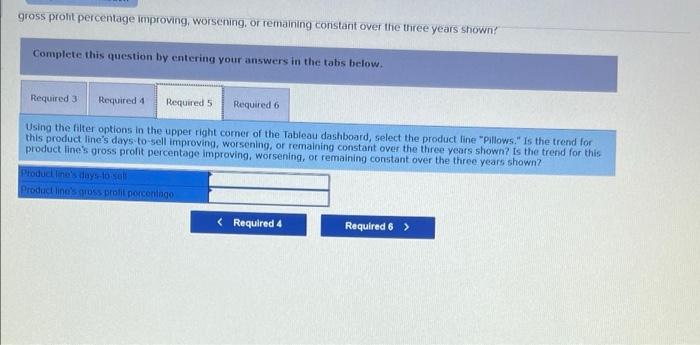
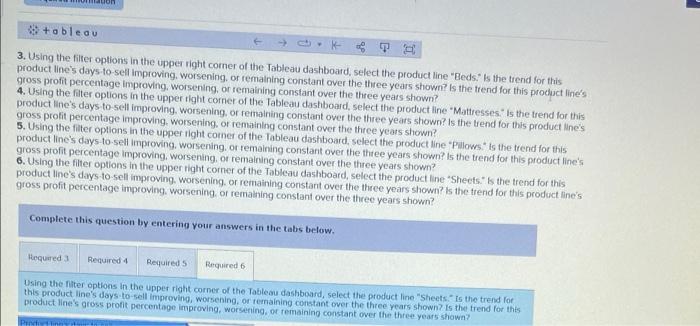
Required information (The following information applies to the questions displayed below) The Slumber Store (TSS) is a national wholesaler of beds, mattresses, pillows, and sheets. Key totals from TSS's most recent and forecasted financial statements are presented in the table below. From the income statement Sales Revenue Cost of Goods Sold Gross Profit Last Year 3560, eee 346,500 213,500 This Year Next Year $615,000 $770,000 405,250 556,300 209.750 213,700 From the balance sheet Inventories Last Year This Year Next Year $ 88,000 $101,808 $179,825 Assume that you work inside TSS's accounting department, and can access the above totals as well as financial data by product line. Use the Tableau dashboard below, which will allow you to use the filter options in the upper right corner of the dashboard to reveal specific amounts, to answer the following questions The Slumber Store (TSS) Financial Data by Product Line Product (AD TO Assume that you work inside TSS's accounting department, and can access the above totals as well as financial data by product line Use the Tableau dashboard below, which will allow you to use the filter options in the upper right corner of the dashboard to reveal specific amounts, to answer the following questions The Slumber Store (TSS) Financial Data by Product Line Product CAIN 100 90 Days-to-Sell 80 70 60 Required information 80% 70% 60% 50% Gross Profit Percentage 4096 30% 2096 1096 096 Last Year This Year Next Year tableau PS 3. Using the filter options in the upper right corner of the Tableau dashboard, select the product line "Beds," is the trend for this gross profit percentage Improving, worsening, or remaining constant over the three years shown! Complete this question by entering your answers in the tabs below. Required 3 Required 4 Required 5 Required 6 Using the filter options in the upper right corner of the Tableau dashboard, select the product line "Sheets. Is the trend for this product line's days to sell improving, worsening, or remaining constant over the three years shown? Is the trend for this product line's gross profit percentage Improving, worsening, or remaining constant over the three years shown? Production days to so Product lino's gross probt porcentage Complete this question by entering your answers in the tabs below. Required 3 Required 4 Required 5 Required 6 Using the filter options in the upper right corner of the Tableau dashboard, select the product line "Beds." is the trend for this product line's days to sell improving, worsening, or remaining constant over the three years shown? Is the trend for this product line's gross profit percentage improving, worsening, or remaining constant over the three years shown? Product line's days to sell Product lines gross prolt percenta RACC neretana mwnc ne romain nature are nown Required information gross pront percentage improving, worsening, or remaining constant over the three years shown? Complete this question by entering your answers in the tabs below. Required 3 Required 4 Required 5 Required 6 Using the filter options in the upper right corner of the Tableau dashboard, select the product line "Mattresses." Is the trend for this product line's days to sell improving, worsening, or remaining constant over the three years shown? Is the trend for this product line's gross profit percentage Improving, worsening, or remaining constant over the three years shown? Product lines days to sol Product line's gross probt porcentago gross proht percentage improving, worsening, or remaining constant over the three years shown! Complete this question by entering your answers in the tabs below. Required 3 Required 4 Required 5 Required 6 Using the filter options in the upper right comer of the Tableau dashboard, select the product line "Pillows." is the trend for this product line's days to sell improving, worsening, or remaining constant over the three years shown? Is the trend for this product line's gross profit percentage improving, worsening, or remaining constant over the three years shown? Product line's days to all Product line's gross profil porcentago tableau 3. Using the filter options in the upper right corner of the Tableau dashboard, select the product line "Beds." is the trend for this product line's days to sell improving, worsening, or remaining constant over the three years shown? Is the trend for this product line's gross profit percentage improving, worsening, or remaining constant over the three years shown? 4. Using the filter options in the upper right corner of the Tableau dashboard, select the product line 'Mattresses." is the trend for this product line's days to sell improving, worsening, or remaining constant over the three years shown? Is the trend for this product line's gross profit percentage improving, worsening, or remaining constant over the three years shown? 5. Using the filter options in the upper right corner of the Tableau dashboard, select the product line Pillows. Is the trend for this product line's days to-self improving, worsening of remaining constant over the three years shown? Is the trend for this product line's gross profit percentage Improving worsening of remaining constant over the three years shown? 6. Using the filter options in the upper right corner of the Tableau dashboard, select the product line 'Sheets.'s the trend for this product line's days to sell improving, worsening, or remaining constant over the three years shown? Is the trend for this product line's gross profit percentage improving, worsening, or remaining constant over the three years shown? Complete this question by entering your answers in the tabs below. Required Required 4 Required 5 Required 6 Using the filter options in the upper right corner of the Tableau dashboard, select the product line "Sheets. Is the trend for this product line's days to sell improving, worsening, or remaining constant over the three years shown is the trend for this product line's gross profit percentage improving, worsening, or remaining constant over the three years shown? Required information (The following information applies to the questions displayed below) The Slumber Store (TSS) is a national wholesaler of beds, mattresses, pillows, and sheets. Key totals from TSS's most recent and forecasted financial statements are presented in the table below. From the income statement Sales Revenue Cost of Goods Sold Gross Profit Last Year 3560, eee 346,500 213,500 This Year Next Year $615,000 $770,000 405,250 556,300 209.750 213,700 From the balance sheet Inventories Last Year This Year Next Year $ 88,000 $101,808 $179,825 Assume that you work inside TSS's accounting department, and can access the above totals as well as financial data by product line. Use the Tableau dashboard below, which will allow you to use the filter options in the upper right corner of the dashboard to reveal specific amounts, to answer the following questions The Slumber Store (TSS) Financial Data by Product Line Product (AD TO Assume that you work inside TSS's accounting department, and can access the above totals as well as financial data by product line Use the Tableau dashboard below, which will allow you to use the filter options in the upper right corner of the dashboard to reveal specific amounts, to answer the following questions The Slumber Store (TSS) Financial Data by Product Line Product CAIN 100 90 Days-to-Sell 80 70 60 Required information 80% 70% 60% 50% Gross Profit Percentage 4096 30% 2096 1096 096 Last Year This Year Next Year tableau PS 3. Using the filter options in the upper right corner of the Tableau dashboard, select the product line "Beds," is the trend for this gross profit percentage Improving, worsening, or remaining constant over the three years shown! Complete this question by entering your answers in the tabs below. Required 3 Required 4 Required 5 Required 6 Using the filter options in the upper right corner of the Tableau dashboard, select the product line "Sheets. Is the trend for this product line's days to sell improving, worsening, or remaining constant over the three years shown? Is the trend for this product line's gross profit percentage Improving, worsening, or remaining constant over the three years shown? Production days to so Product lino's gross probt porcentage Complete this question by entering your answers in the tabs below. Required 3 Required 4 Required 5 Required 6 Using the filter options in the upper right corner of the Tableau dashboard, select the product line "Beds." is the trend for this product line's days to sell improving, worsening, or remaining constant over the three years shown? Is the trend for this product line's gross profit percentage improving, worsening, or remaining constant over the three years shown? Product line's days to sell Product lines gross prolt percenta RACC neretana mwnc ne romain nature are nown Required information gross pront percentage improving, worsening, or remaining constant over the three years shown? Complete this question by entering your answers in the tabs below. Required 3 Required 4 Required 5 Required 6 Using the filter options in the upper right corner of the Tableau dashboard, select the product line "Mattresses." Is the trend for this product line's days to sell improving, worsening, or remaining constant over the three years shown? Is the trend for this product line's gross profit percentage Improving, worsening, or remaining constant over the three years shown? Product lines days to sol Product line's gross probt porcentago gross proht percentage improving, worsening, or remaining constant over the three years shown! Complete this question by entering your answers in the tabs below. Required 3 Required 4 Required 5 Required 6 Using the filter options in the upper right comer of the Tableau dashboard, select the product line "Pillows." is the trend for this product line's days to sell improving, worsening, or remaining constant over the three years shown? Is the trend for this product line's gross profit percentage improving, worsening, or remaining constant over the three years shown? Product line's days to all Product line's gross profil porcentago tableau 3. Using the filter options in the upper right corner of the Tableau dashboard, select the product line "Beds." is the trend for this product line's days to sell improving, worsening, or remaining constant over the three years shown? Is the trend for this product line's gross profit percentage improving, worsening, or remaining constant over the three years shown? 4. Using the filter options in the upper right corner of the Tableau dashboard, select the product line 'Mattresses." is the trend for this product line's days to sell improving, worsening, or remaining constant over the three years shown? Is the trend for this product line's gross profit percentage improving, worsening, or remaining constant over the three years shown? 5. Using the filter options in the upper right corner of the Tableau dashboard, select the product line Pillows. Is the trend for this product line's days to-self improving, worsening of remaining constant over the three years shown? Is the trend for this product line's gross profit percentage Improving worsening of remaining constant over the three years shown? 6. Using the filter options in the upper right corner of the Tableau dashboard, select the product line 'Sheets.'s the trend for this product line's days to sell improving, worsening, or remaining constant over the three years shown? Is the trend for this product line's gross profit percentage improving, worsening, or remaining constant over the three years shown? Complete this question by entering your answers in the tabs below. Required Required 4 Required 5 Required 6 Using the filter options in the upper right corner of the Tableau dashboard, select the product line "Sheets. Is the trend for this product line's days to sell improving, worsening, or remaining constant over the three years shown is the trend for this product line's gross profit percentage improving, worsening, or remaining constant over the three years shown
