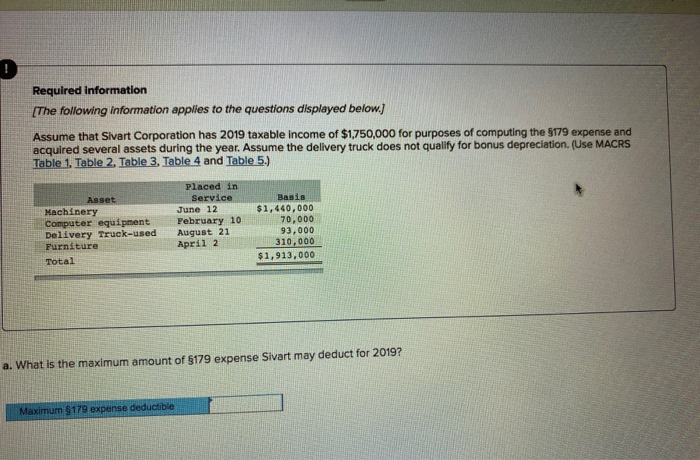
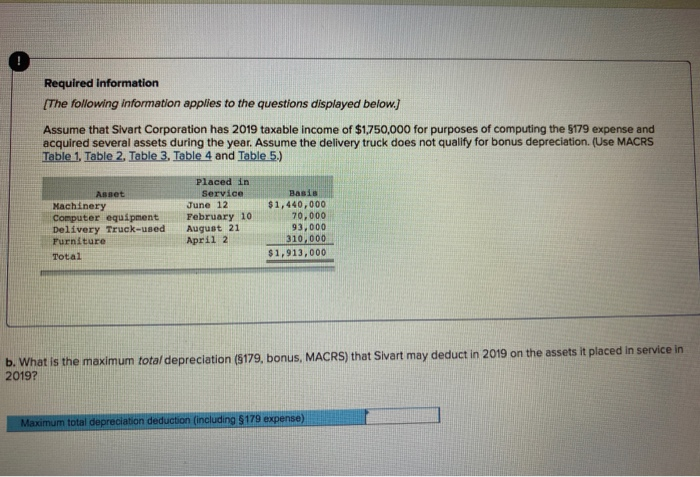
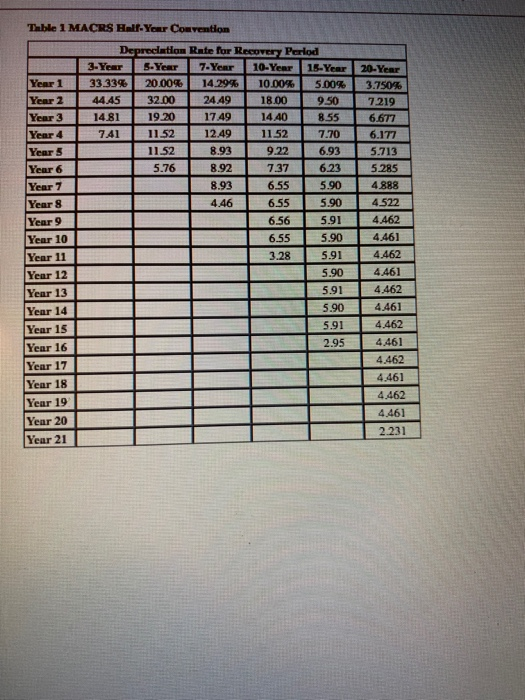
Required information [The following information applies to the questions displayed below. Assume that Sivart Corporation has 2019 taxable income of $1,750,000 for purposes of computing the 5179 expense and acquired several assets during the year. Assume the delivery truck does not qualify for bonus depreciation. (Use MACRS Table 1. Table 2, Table 3. Table 4 and Table 5.) Placed in Basis Service Asset $1,440,000 70,000 3,000 310,000 June 12 February 10 August 21 April 2 Machinery Computer equipment Delivery Truck-used Furniture $1,913,000 Total a. What is the maximum amount of $179 expense Sivart may deduct for 2019? Maximum $179 expense deductible ! Required information The following information applies to the questions displayed below Assume that Sivart Corporation has 2019 taxable income of $1,750,000 for purposes of computing the 5179 expense and acquired several assets during the year. Assume the delivery truck does not qualify for bonus depreciation. (Use MACRS Table 1, Table 2, Table 3, Table 4 and Table 5.) Placed in Service Basis Asset $1,440,000 70,000 93,000 310,000 Machinery Computer equipment Delivery Truck-used Furniture June 12 February 10 August 21 April 2 $1,913,000 Total b. What is the maximum total depreciation ($179, bonus, MACRS) that Sivart may deduct in 2019 on the assets it placed in service in 2019? Maximum total depreciation deduction (including $179 expense) Table 1 MACRS Half-Yer Convention Depreclation Rate for Recovery Perlod 3-Year 5-Year 7-Year 10-Year 15-Year 20-Year Year 1 33.33% 20.00% 14.29% 10.00% 5.00% 3.750% Year 2 24.49 18.00 44 45 32.00 9.50 7.219 Year 3 14.81 19.20 17.49 14 40 8.55 6.677 Year 4 11.52 12.49 1152 7.70 741 6.177 11.52 8.93 9.22 6.93 5.713 Year 5 8.92 6.23 Year 6 5.76 7.37 5.285 Year 7 Year 8 8.93 6.55 5.90 4888 5.90 4522 4.46 6.55 4.462 6.56 5.91 Year 9 5.90 4.461 Year 10 6.55 5.91 4.462 3.28 Year 11 5.90 4.461 Year 12 4462 Year 13 Year 14 Year 15 5.91 5.90 4.461 4.462 5.91 4.461 2.95 Year 16 4.462 Year 17 4.461 Year 18 4.462 Year 19 Year 20 Year 21 4.461 2.231 TABLE 2a MACRS Mid-Quarter Conventionr For property placed in service during the first quarter Depreclation Rate for Recovery Perlod 7-Year S-Year Year 1 35.00% 25.00% Year 2 26.00 21.43 Year 3 15.60 1531 Year 4 11.01 10.93 Year 5 1101 8.75 Year 6 1.38 8.74 Year 7 8.75 Year 8 1.09 TABLE 2b MACRS Mid-Quarter Conventionm: For property placed in service during the second quarter Depreciation Rate for Recovery Period 5.Year 25.00% 7-Year Year 1 17.85% Year 2 30.00 23.47 Year 3 18.00 16.76 Year 4 11.37 11.97 Year 5 1137 8.87 Year 6 Year 7 4.26 8.87 8.87 Year 8 334 TABLE 2c MACRS Mid-Quarter Convention: For property placed in service during the thind quarter Depreciation Rate for Recovery Period 5-Year 7-Year 15.00% Year 1 10.71% 25.51 Year 2 34 00 18.22 Year 3 20.40 13.02 Year 4 1224 Year 5 11.30 9.30 8.85 Year 6 706 Year 7 886 Year 8 S53 TABLE 2d MACRS-Mid Quarter Convention: For property placed in service during the fourth quarter Depreciation Rate for Recovery Period 5iYear 7 Year Year I Year 3.57 5000% 27.55 38.00 22 80 13 68 Year 3 19.68 1406 10.04 Year 4 Year 5 10.04 9.58 Year 6 8.73 Year7 764 Year 8 TABLE 3 Reskdewtial Reatal Property Mid-Moatk Convention Straight Line-275 Years Month Property Placed in Service Mosth Month 1 Month 2 Momth 3 Month 4 Month 5 Month 6 Month 7 Month 8Month 9 Month 11 Month 12 10 2879% 2576% 2.273% 3.485% 1667% Year 1 3.18296 1970% 1364% 1061% 0455% 0.758% 0.152% Year 2 3.636 3636 3.636 3.636 3.636 3.636 3.636 3.636 3636 3.636 3.636 3.636 9 Year 3.637 3.637 3.637 3637 3637 3.637 3.636 3.636 3636 3.636 3.636 3.636 10 Year 3.636 3.636 3.637 3.636 3.636 3.636 3.636 3.637 3637 3637 3.637 11 LESE Year 3637 3.637 3.637 3.637 3637 3.637 3.636 3636 3.636 3636 3636 3.636 12 Year 3.636 3.637 3.636 3.636 3.636 3.636 3.636 3.637 3.637 3.637 3637 3.637 13 Year 3.637 3.637 3.637 3.637 3.637 3.637 3.636 3.636 3.636 3.636 3.636 3636 14 Year 3.636 3.636 3.636 3.636 3.636 3.636 3.637 3637 3.637 3.637 3.637 3637 15 Year 3.637 3.637 3.637 3.637 3.636 3636 3.637 3.637 3.636 3636 3.636 3636 16 Year 3.636 3.636 3.637 3637 3.636 3.636 3.636 3.636 3.637 3.637 3.637 3.637 17 Year 3.637 3.637 3.636 3636 3.637 3.637 3.637 3.637 3.636 3.636 3.636 3.636 18 Year 3.636 3.636 3.636 3.636 3.637 3.636 3.636 3.637 3.637 3.637 3.637 3637 19 Year 3.637 3.637 3.637 3637 3.636 3.636 3.636 616 3.637 3.637 3.636 3636 20 Year 3.636 3.636 3.636 3.636 3.636 3.636 3.637 3.637 3.637 3.637 3.637 3.637 21 Year 22 3.636 3.637 3.637 3.637 3.637 3.636 3.636 3.636 3.636 3.637 3.637 3.636 Year 3.636 3.636 3.636 3.636 3.637 3.637 3.637 3.637 3.637 3637 3.636 3.636 23 Year 3.637 3.637 9E9E 3.636 3.636 3,637 3.636 3.636 3.637 3.637 3.637 24 Year 3637 3.636 3.636 3.637 3.637 3.637 3.637 3.637 3.636 3.636 3.636 3.636 25 Year 3.636 3.637 3.637 3.637 3.637 3.636 3.636 3.636 3.636 3636 3.637 3.637 26 Year 3.637 3.637 3.636 3.637 3.637 3.637 3.636 3.636 3.636 3.636 3.636 3,637 27 Year 28 3.636 3636 3.636 3636 3.636 197 2273 2576 2879 3.182 3.485 3616 Year 291 1667 1.061 1.364 0.152 0455 a758 TABLE 4 Nonrealdential Real Property Mid-Month Conventlon Stralght Line-31.8 Years (for asets placed In service before May 13, 1993) Month Property Placed In Service Month 7 Month 1 Month 2 2.778% Month 4 Month 3 Month 5 Month 6 Month 8 Month 9 Month 10 Month 11 Month Year 1 3.042% 2.513% 2.249% 1.984% 3.175 1455% 1.720% 1.190% 0.926% 0.661% 0.397% 3.175 3.175 3.174 0.1329 Year 2-7 3.175 3.175 3.175 3.175 3.175 3.175 3.175 3.175 3.175 3.175 3.175 Year 8 3.175 3.174 3.175 3.174 3.175 3.174 3.175 3.175 3.175 3.175 3.174 Year 9 3.175 3.174 3.175 3.174 3.174 3.175 3.174 3.175 3.174 3.175 3.175 Year 10 3.175 3.174 3.175 3.175 3.174 3.175 3.174 3.175 3.174 3.175 3.174 3.174 3.174 Year 11 3.175 3.174 3.175 3.174 3.175 3.174 3.175 3.174 3.175 3.175 Year 12 3.175 3.174 3.175 3.174 3.175 3.174 3.175 3.174 3.175 3.174 3.175 3.174 Year 13 3.174 3.175 3.174 3.175 3.174 3.175 3.174 3.175 3.174 3.175 3.174 3.175 Year 14 3.175 3.174 3.175 3.174 3.175 3.174 3.175 3.174 3.175 3.174 3.175 3.174 Year 15 3.174 3.175 3.174 3.175 3.174 3.175 3.174 3.175 3.174 3.175 3.174 3.175 Year 16 3.175 3.174 3.175 3.174 3.174 3.174 3.174 3.175 3.175 3.175 3.175 3.174 3.174 Year 17 3.174 3.175 3.175 3.174 3.175 3.174 3.175 3.175 3.174 3.174 3.175 Year 18 3.175 3.174 3.175 3.174 .17 3.174 3.175 3.174 3.175 3.174 3.175 3.174 Year 19 3.174 3.175 3.174 3.175 3.174 3.175 3.174 3.175 3.174 3.175 3.174 3.175 Year 20 3.175 3.174 3.175 3.174 3.175 3.174 3.175 3.174 3.175 3.174 3.175 3.174 3.175 Year 21 3.174 3.174 3.175 3.174 3.175 3.174 3.175 3.174 3.175 3.175 3.174 3.175 Year 22 3.174 3.175 3.174 3.175 3.175 3.174 3.175 3.174 3.174 3.175 3.174 Year 23 3.174 3.175 3.174 3.175 3.174 3.175 3.175 3.174 3.115 3.174 3.174 3.175 3.175 Year 24 3.175 3.174 3.174 3.175 3.175 3.174 3.174 3.175 3.174 3.174 3.175 Year 25 3.174 3.174 3.175 3.175 3.174 3.175 3.174 3.175 3.174 3.175 3.174 3.175 Year 26 3.175 3.174 3.175 3.174 3.174 3.175 3.175 3.174 3.175 3.174 3.175 3.174 3.175 3.174 Year 27 3.175 3.174 3.175 3.174 3.174 3.175 3.175 3.175 3.174 3.175 3.174 Year 28 3.174 3.175 3.174 3.175 3.175 3.174 3.174 3.175 3.174 3.175 3.174 3.175 3.174 3.175 3.174 Year 29 3.174 3.175 3.174 3.174 3.175 3.174 3.175 3.174 3.175 Year 30 3.175 3.175 3.174 3.175 3.174 3.175 3.175 3.175 3.174 3.174 3.174 Year 31 3.174 3.175 3.174 3.175 3.174 3.175 3.174 3.175 3.174 3.175 3.174 3.174 3.175 Year 32 2.513 1.720 1984 2:249 2.778 3042 3.175 3.174 3.175 3.175 3.174 Year 33 0.926 1455 0.132 0.397 0.661 1.190 TABLE 5 Noeresidential Real Property Mid-Month Convention Stralght Line-39 Years (for sets plnced in service on or after May 13, 1993) Month Property Placed In Service Month 5 Month 9 Month 10 Mosth 7 Month 8 Month 11 Month 12 Month 3 Month 6 Month 4 Month 1 Mosth 2 L.177% 2.564 0.963% 2 564 0.749% 2.564 1819 0535% 0.107% 1391% 0.321% 1,605% 2.033% 1819% Year 1 Year 2-39 2247% 2.461% 2564 1.177 2.564 2033 2.564 2.564 2.564 2564 0.749 2.564 2.564 2.564 0.107 2.461 1391 1.605 2.247 0.535 0.963 0.321 Year 40