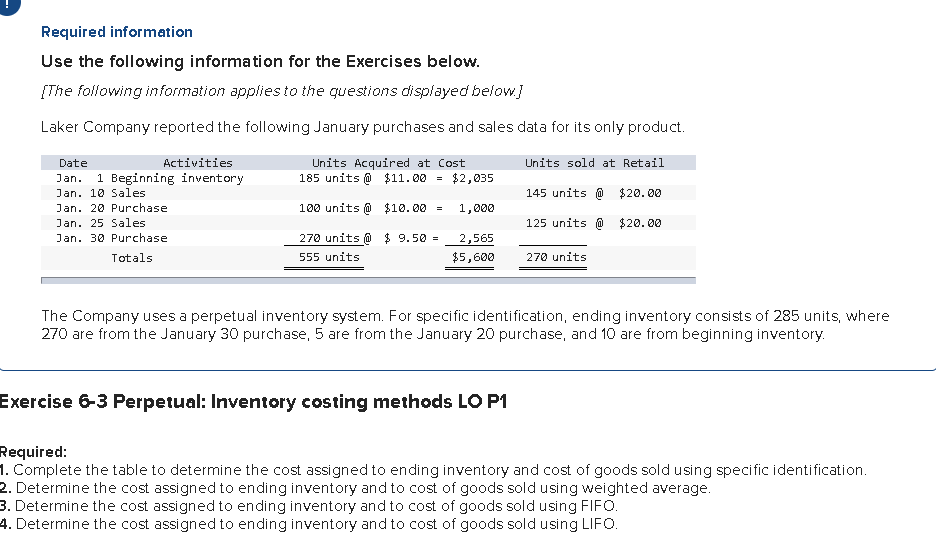
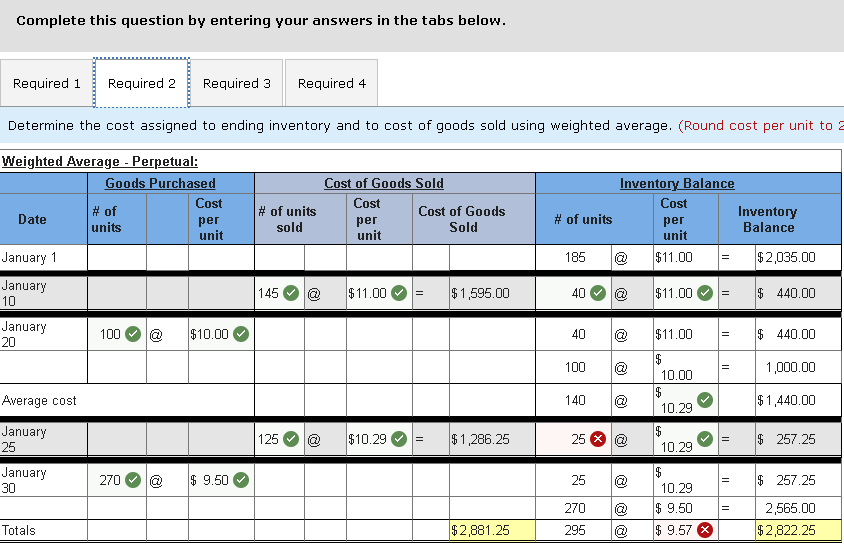
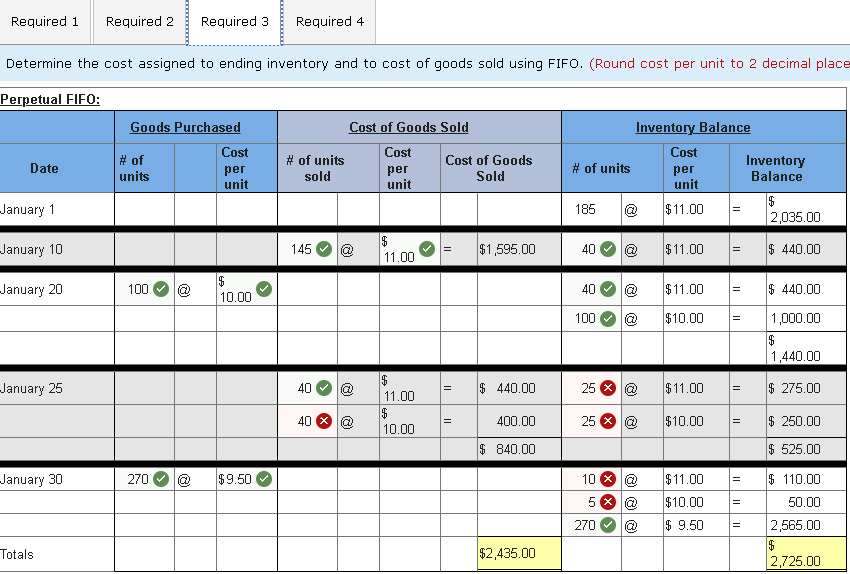
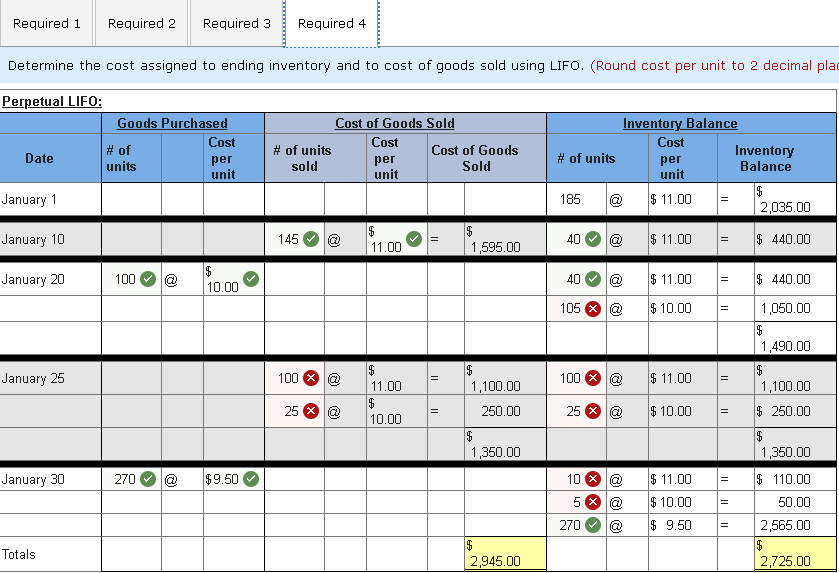
Required information Use the following information for the Exercises below. [The following information applies to the questions displayed below.] Laker Company reported the following January purchases and sales data for its only product. Units sold at Retail Units Acquired at Cost 185 units @ $11.00 $2,035 = 145 units @ $20.00 Date Activities Jan. 1 Beginning inventory Jan. 10 Sales Jan. 20 Purchase Jan. 25 Sales Jan. 30 Purchase Totals 100 units @ $10.00 = 1,000 125 units @ $20.00 270 units @ $ 9.50 = 555 units 2,565 $5,600 270 units The Company uses a perpetual inventory system. For specific identification, ending inventory consists of 285 units, where 270 are from the January 30 purchase, 5 are from the January 20 purchase, and 10 are from beginning inventory. Exercise 6-3 Perpetual: Inventory costing methods LO P1 Required: 1. Complete the table to determine the cost assigned to ending inventory and cost of goods sold using specific identification. 2. Determine the cost assigned to ending inventory and to cost of goods sold using weighted average. 3. Determine the cost assigned to ending inventory and to cost of goods sold using FIFO. 4. Determine the cost assigned to ending inventory and to cost of goods sold using LIFO. Complete this question by entering your answers in the tabs below. Required 1 Required 2 Required 3 Required 4 Determine the cost assigned to ending inventory and to cost of goods sold using weighted average. (Round cost per unit to a # of units sold Cost of Goods Sold Cost per Cost of Goods unit Sold # of units Weighted Average - Perpetual: Goods Purchased Cost # of Date per units unit January 1 January 10 January 100 $10.00 20 Inventory Balance Cost per Inventory Balance unit $11.00 $2,035.00 185 145 $11.00 $1,595.00 40 @ $11.00 = $ 440.00 40 @ $11.00 $ 440.00 100 1,000.00 $ 10.00 $ 10.29 Average cost 140 @ $1,440.00 125 @ $10.29 $1,286.25 25 X @) $ 10.29 > $ 257.25 January 25 January 30 $ 270 @ $ 9.50 25 @ $ 257.25 @ 270 295 10.29 $ 9.50 $ 9.57 X 2,565.00 $2,822.25 Totals $2,881.25 Required 1 Required 2 Required 3 Required 4 Determine the cost assigned to ending inventory and to cost of goods sold using FIFO. (Round cost per unit to 2 decimal place Perpetual FIFO: Goods Purchased Cost # of per units unit Cost of Goods Sold # of units Cost Cost of Goods sold per unit Sold Date Inventory Balance Cost # of units Inventory per Balance unit $ 185 a $11.00 2,035.00 January 1 January 10 145 @ $ 11.00 $1,595.00 40 @ $11.00 $ 440.00 January 20 100 $ 10.00 40 $11.00 $ 440.00 @ @ 100 $10.00 = 1,000.00 $ 1,440.00 January 25 40 a = $ 440.00 25 X @ $11.00 = $ 275.00 $ 11.00 $ 10.00 40 @ 400.00 25 X @ $10.00 $ 250.00 $ 840.00 $ 525.00 January 30 270 $9.50 $11.00 10 X @ 5 270 a $10.00 $ 9.50 $ 110.00 50.00 2,565.00 $ 2,725.00 Totals $2,435.00 Required 1 Required 2 Required 3 Required 4 Determine the cost assigned to ending inventory and to cost of goods sold using LIFO. (Round cost per unit to 2 decimal pla Perpetual LIFO: Goods Purchased Cost # of Date units per unit Cost of Goods Sold Cost # of units Cost of Goods sold per Sold unit # of units Inventory Balance Cost per Inventory unit Balance $ $ 11.00 2,035.00 January 1 185 January 10 145 $ 11.00 40 $ 11.00 $ 440.00 1,595.00 January 20 100 $ 10.00 40 $ 11.00 $ 440.00 105 X @ $ 10.00 January 25 100 X @ 100X @ $ 11.00 = 11.00 $ 10.00 25 X @ 1,050.00 $ 1,490.00 $ 1,100.00 $ 250.00 $ 1,350.00 $ 1,100.00 250.00 $ 1,350.00 = 25 X @ $ 10.00 January 30 270 $9.50 10 X @ 5X @ 270 @ $ 11.00 $ 10.00 $ 9.50 $ 110.00 50.00 2,565.00 $ 2,725.00 $ 2,945.00 Totals