

Question
REQUIRED: Please Prepare common-sized financial statements for this company for the period 19871991. For that same period, compute for Leslie Fay the ratios shown in
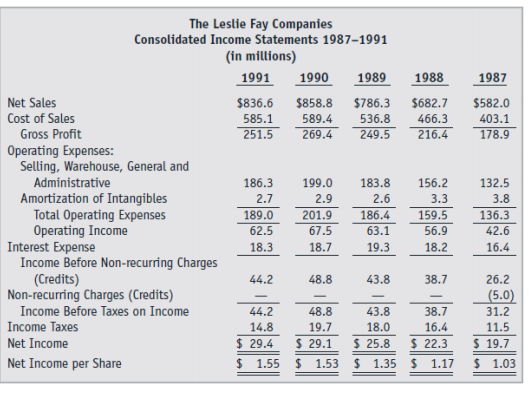
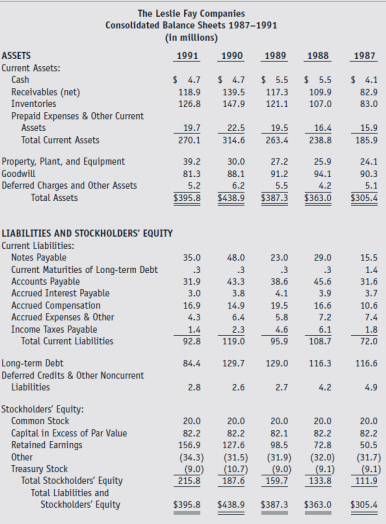
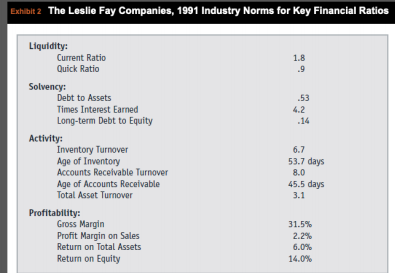
REQUIRED: Please Prepare common-sized financial statements for this company for the period 19871991. For that same period, compute for Leslie Fay the ratios shown in Exhibit 2. Given these data, which financial statement items do you believe should have been a red flag (in terms of potential fraud) for the audit firm that performed this companys audit in 1991? Please explain why.
\begin{tabular}{|c|c|c|c|c|c|} \hline \multicolumn{6}{|c|}{\begin{tabular}{l} The Lestie Fay Companies \\ Consolidated Income Statements 1987-1991 \\ (in millions) \end{tabular}} \\ \hline & 1991 & 1990 & 1989 & 1988 & 1987 \\ \hline Net Sales & $836.6 & $858.8 & $786.3 & $682.7 & $582.0 \\ \hline Cost of Sales & 585.1 & 589.4 & 536.8 & 466.3 & 403.1 \\ \hline Gross Profit & 251.5 & 269.4 & 249.5 & 216.4 & 178.9 \\ \hline \multicolumn{6}{|l|}{ Operating Expenses: } \\ \hline \multicolumn{6}{|l|}{ Selling, Warehouse, General and } \\ \hline Administrative & 186.3 & 199.0 & 183.8 & 156.2 & 132.5 \\ \hline Amortization of Intangibles & 2.7 & 2.9 & 2.6 & 3.3 & 3.8 \\ \hline Total Operating Expenses & 189.0 & 201.9 & 186.4 & 159.5 & 136.3 \\ \hline Operating Income & 62.5 & 67.5 & 63.1 & 56.9 & 42.6 \\ \hline Interest Expense & 18.3 & 18.7 & 19.3 & 18.2 & 16.4 \\ \hline \begin{tabular}{l} Income Before Non-recurring Cha \\ (Credits) \end{tabular} & 44.2 & 48.8 & 43.8 & 38.7 & 26.2 \\ \hline Non-recurring Charges (Credits) & - & - & - & - & (5.0) \\ \hline Income Before Taxes on Income & 44.2 & 48.8 & 43.8 & 38.7 & 31.2 \\ \hline Income Taxes & 14.8 & 19.7 & 18.0 & 16.4 & 11.5 \\ \hline Net Income & $29.4 & $29.1 & $25.8 & $22.3 & $19.7 \\ \hline Net Income per Share & $1.55 & $1.53 & & \begin{tabular}{ll} $ & 1.17 \\ \end{tabular} & $1.03 \\ \hline \end{tabular} \begin{tabular}{|c|c|c|c|c|c|} \hline \multirow{2}{*}{\begin{tabular}{l} ASSETS \\ Current Assets: \end{tabular}} & \begin{tabular}{l} stie Fay Co \\ Balance Sh \\ (in miltion \end{tabular} & \begin{tabular}{l} npanies \\ ets 1987 \\ ) \end{tabular} & 991 & \multirow[b]{2}{*}{1988} & \multirow[b]{2}{*}{1987} \\ \hline & 1991 & 1990 & \multirow[t]{2}{*}{1989} & & \\ \hline Current Assets: & & & & \multirow[b]{2}{*}{$} & \multirow[b]{2}{*}{$4.1} \\ \hline Cash & \begin{tabular}{ll} $ & 4.7 \end{tabular} & \begin{tabular}{ll} $ & 4.7 \end{tabular} & $5.5 & & \\ \hline Receivables (net) & 118.9 & 139.5 & 117.3 & 109.9 & 82.9 \\ \hline Inventories & 126.8 & 147.9 & 121.1 & 107.0 & 83.0 \\ \hline \multicolumn{6}{|l|}{ Prepaid Expenses \& Other Current } \\ \hline Assets & 19.7 & 22.5 & 19.5 & 16.4 & 15.9 \\ \hline Total Current Assets & 270.1 & 314.6 & 263.4 & 238.8 & 185.9 \\ \hline Property, Plant, and Equipment & 39.2 & 30.0 & 27.2 & 25.9 & 24.1 \\ \hline Goodwill & 81.3 & 88.1 & 91.2 & 94.1 & 90.3 \\ \hline Deferred Charges and Other Assets & 5.2 & 6.2 & 5.5 & 4.2 & 5.1 \\ \hline Total Assets & $395.8 & $438.9 & $387.3 & & \\ \hline \multicolumn{6}{|l|}{ LIABILITIES AND STOCKHOLDERS' EQUITY } \\ \hline Notes Payable & 35.0 & 48.0 & 23.0 & 29.0 & 15.5 \\ \hline Current Maturities of Long-term Debt & .3 & .3 & .3 & .3 & 1.4 \\ \hline Accounts Payable & 31.9 & 43.3 & 38.6 & 45.6 & 31.6 \\ \hline Accrued Interest Payable & 3.0 & 3.8 & 4.1 & 3.9 & 3.7 \\ \hline Accrued Compensation & 16.9 & 14.9 & 19.5 & 16.6 & 10.6 \\ \hline Accrued Expenses \& Other & 4.3 & 6.4 & 5.8 & 7.2 & 7.4 \\ \hline Income Taxes Payable & 1.4 & 2.3 & 4.6 & 6.1 & 1.8 \\ \hline Total Current Liabilities & 92.8 & 119.0 & 95.9 & 108.7 & 72.0 \\ \hline Long-term Debt & 84.4 & 129.7 & 129.0 & 116.3 & 116.6 \\ \hline Deferred Credits \& Other Noncurrent & & & & & \\ \hline Liabilities & 2.8 & 2.6 & 2.7 & 4.2 & 4.9 \\ \hline \multicolumn{6}{|l|}{ Stockholders' Equity: } \\ \hline Common Stock & 20.0 & 20.0 & 20.0 & 20.0 & 20.0 \\ \hline Capital in Excess of Par Value & 82.2 & 82.2 & 82.1 & 82.2 & 82.2 \\ \hline Retained Earnings & 156.9 & 127.6 & 98.5 & 72.8 & 50.5 \\ \hline Other & (34.3) & (31.5) & (31.9) & (32.0) & (31.7) \\ \hline Treasury Stock & (9.0) & (10.7) & (9.0) & (9.1) & (9.1) \\ \hline Total Stockholders' Equity & 215.8 & 187.6 & 159.7 & 133.8 & 111.9 \\ \hline Total Liabilities and & & & & & \\ \hline Stockholders' Equity & $395.8 & $438.9 & $387.3 & $363.0 & $305.4 \\ \hline \end{tabular} Exhlbit 2 The Leslie Fay Companies, 1991 Industry Norms for Key Financial Ratios Liquidity: Current Ratio Quick Ratio 1.8 .9 Solvency: \begin{tabular}{lc} Debt to Assets & .53 \\ Times Interest Eamed & 4.2 \\ Long-term Debt to Equity & .14 \end{tabular} Activity: Inventory Turnover Age of Inventory Accounts Receivable Turnover Age of Accounts Receivable Total Asset Turnover Profitability: Gross Margin Profit Margin on Sales Return on Total Assets Return on Equity 6.7 53.7 days 8.0 45.5 days 3.1 31.5% 2.2% 6.0% 14.0%
Step by Step Solution
There are 3 Steps involved in it
Step: 1

Get Instant Access to Expert-Tailored Solutions
See step-by-step solutions with expert insights and AI powered tools for academic success
Step: 2

Step: 3
Ace Your Homework with AI
Get the answers you need in no time with our AI-driven, step-by-step assistance
Get Started
Cost And Management Accounting
Authors: Colin Drury
9th Edition
1473749050, 978-1473749054