Required Tools: This lab uses the Ohm's Law simulation provided by PhET at the University of Colorado Boulder. You need to use a graphing application
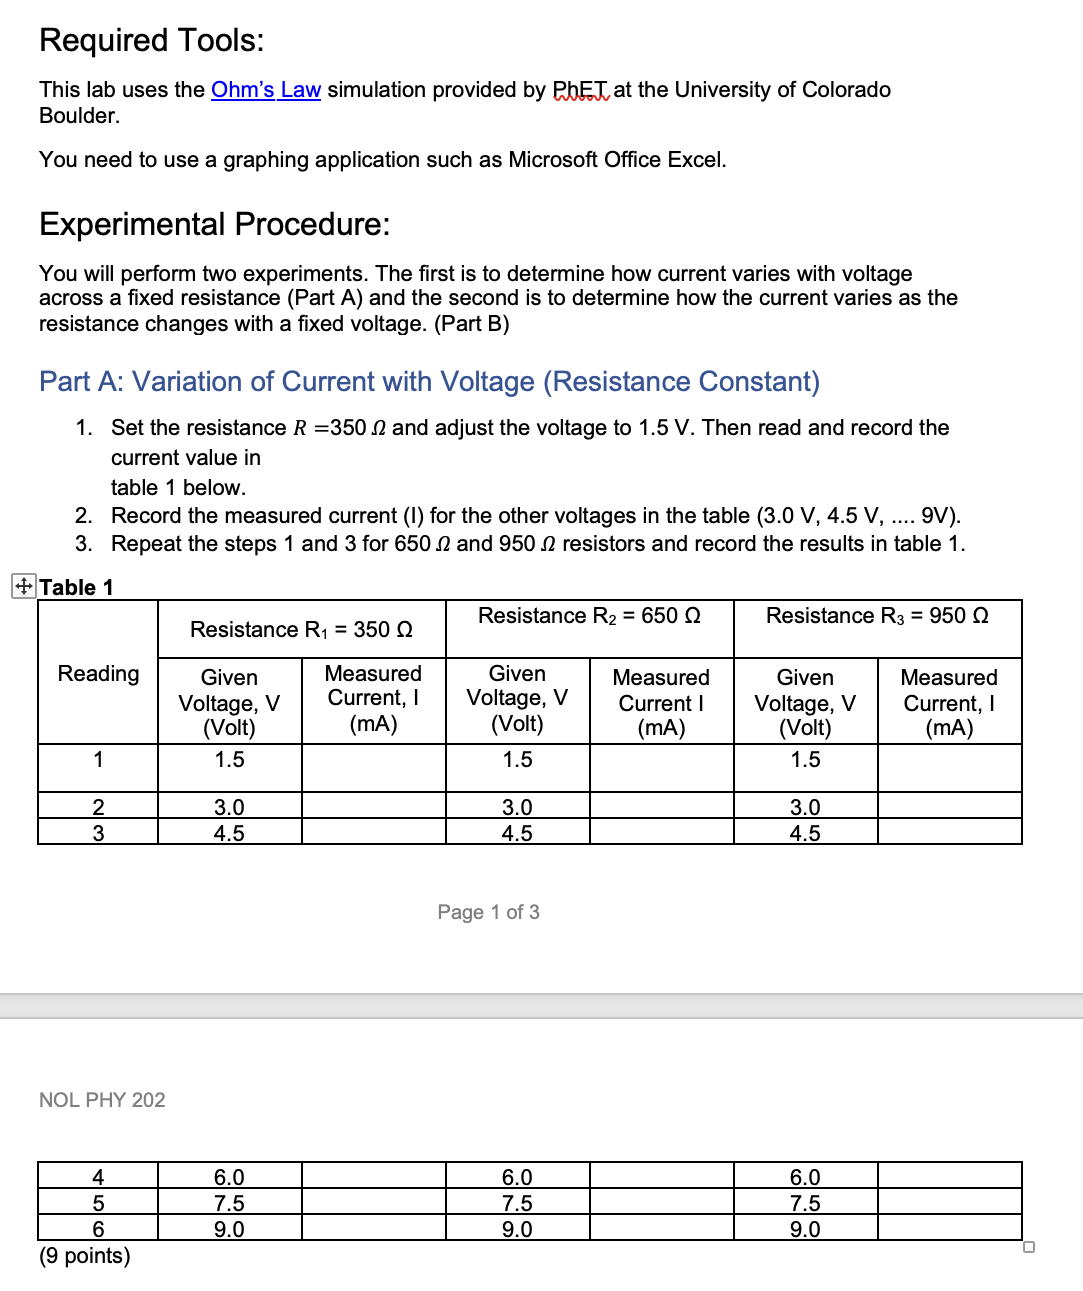
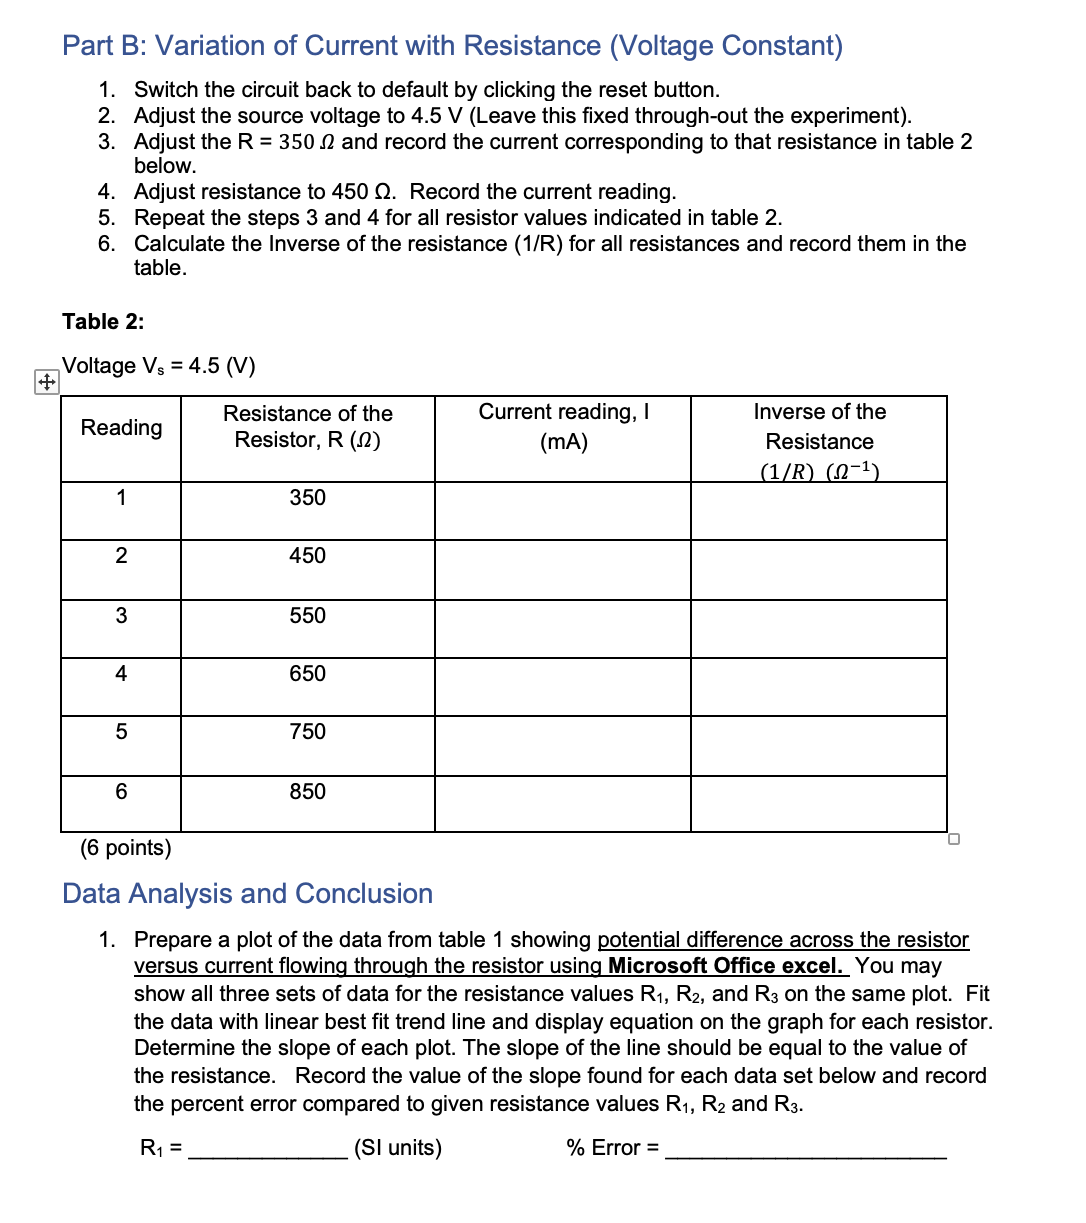
Required Tools: This lab uses the Ohm's Law simulation provided by PhET at the University of Colorado Boulder. You need to use a graphing application such as Microsoft Office Excel. Experimental Procedure: You will perform two experiments. The first is to determine how current varies with voltage across a fixed resistance (Part A) and the second is to determine how the current varies as the resistance changes with a fixed voltage. (Part B) Part A: Variation of Current with Voltage (Resistance Constant) 1. Set the resistance R =350 0 and adjust the voltage to 1.5 V. Then read and record the current value in table 1 below. 2. Record the measured current (1) for the other voltages in the table (3.0 V, 4.5 V, .... 9V). 3. Repeat the steps 1 and 3 for 650 0 and 950 0 resistors and record the results in table 1. + Table 1 Resistance R1 = 350 Q Resistance R2 = 650 0 Resistance R3 = 950 0 Reading Given Measured Given Measured Given Measured Voltage, V Current, I Voltage, V Current I Voltage, V Current, I (Volt) (mA) (Volt) (mA) (Volt) (mA) 1 1.5 1.5 1.5 3.0 3.0 3.0 C N 4.5 4.5 4.5 Page 1 of 3 NOL PHY 202 4 6.0 6.0 6.0 7.5 7.5 7.5 6 9.0 9.0 9.0 (9 points)Part B: Variation of Current with Resistance (Voltage Constant) 1. 2. 3 4. 5. 6 Switch the circuit back to default by clicking the reset button. Adjust the source voltage to 4.5 V (Leave this xed through-out the experiment). Adjust the R = 350 I) and record the current corresponding to that resistance in table 2 below. Adjust resistance to 450 0. Record the current reading. Repeat the steps 3 and 4 for all resistor values indicated in table 2. Calculate the Inverse of the resistance (HR) for all resistances and record them in the table. Table 2: 4. Voltage Vs = 4.5 (V) R d' Resistance of the Current reading, | Inverse of the ea Ing Resistor, R (.0) (mA) Resistance 1 R 121 (6 points) Data Analysis and Conclusion 1. Prepare a plot of the data from table 1 showing potential difference across the resistor versus current flowing through the resistor using Microsoft Ofce excel. You may show all three sets of data for the resistance values R1, R2, and R3 on the same plot. Fit the data with linear best fit trend line and display equation on the graph for each resistor. Determine the slope of each plot. The slope of the line should be equal to the value of the resistance. Record the value of the slope found for each data set below and record the percent error compared to given resistance values R1, R2 and R3. R1 = (SI units) % Error = NO L PHY 202 (Show your work for % error calculation) R2 = (SI units) % Error = R}' = (SI units) % Error = (9 points) NOTE: When you plot graphs, make sure all physical quantities must be in SI units. 2. Prepare a plot of the data from table 2 showing the current owing through the resistor versus the inverse of the resistance of the resistor (HR) using Microsoft Office excel. Fit the data with linear best t trend line and display equation of best t line on the graph. What is the slope of the line? (1 point) Compare it with the constant value of V5. using percent error. According to Ohm's law, these values should be equal, are they? Provide a brief explanation with the percent error for your answer (3 points) 3. Do the experimental data confirm that the electric current owing through the resistor is directly proportional to the electric potential difference across the resistor provided by the batteries? Explain clearly. (2 points) 4. Do the experimental data confirm that the electric current owing through the resistor is inversely proportional to the Resistance for a fixed electric potential difference across the resistor? Explain clearly. (2 points) 5. Copy and paste both graphs from Table 1 and Table 2 to the word document. (8 points)
Step by Step Solution
There are 3 Steps involved in it
Step: 1
Get Instant Access to Expert-Tailored Solutions
See step-by-step solutions with expert insights and AI powered tools for academic success
Step: 2
Step: 3
Ace Your Homework with AI
Get the answers you need in no time with our AI-driven, step-by-step assistance