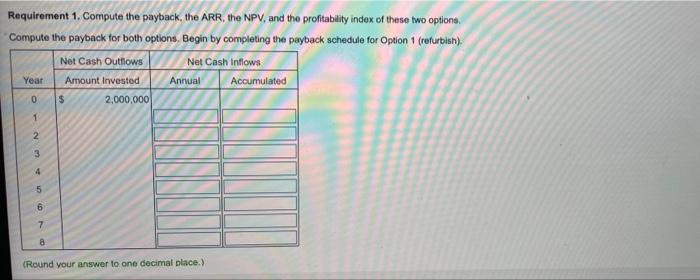
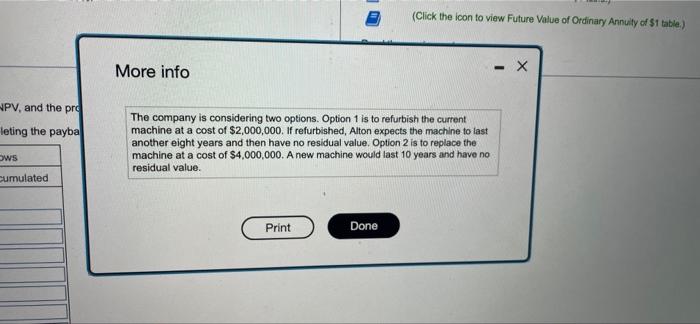
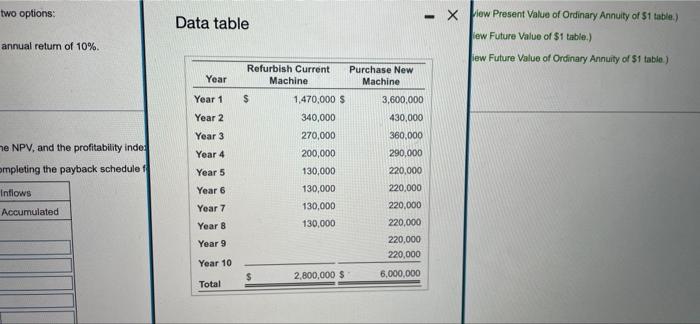
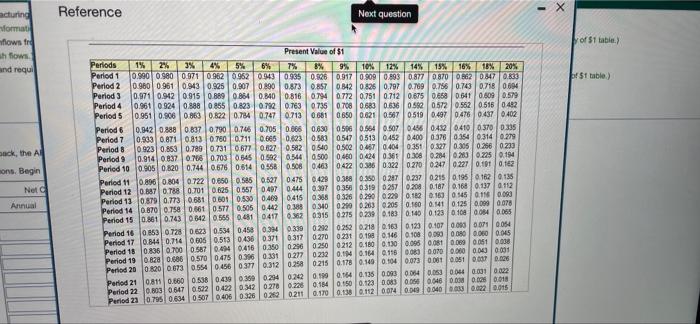
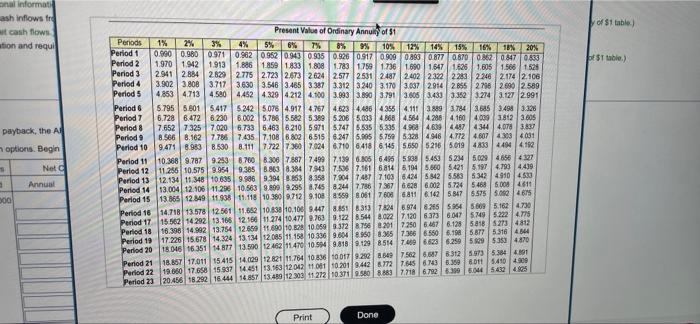
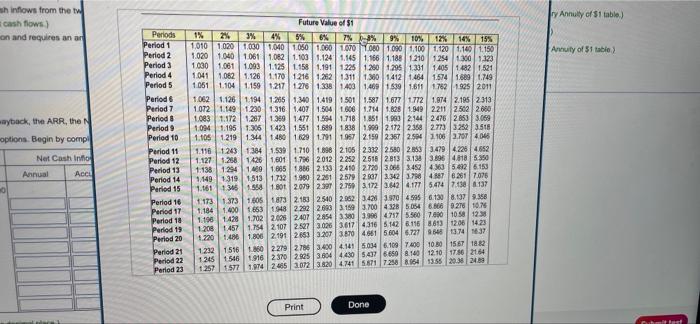
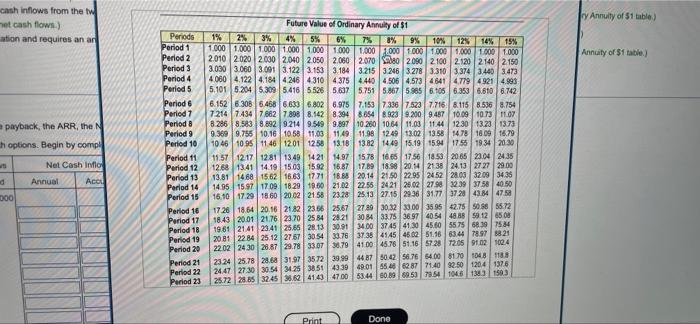
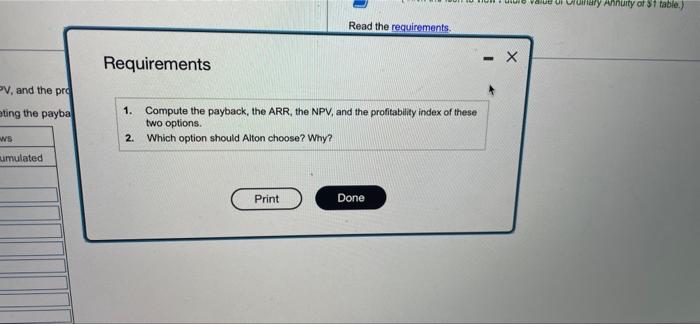
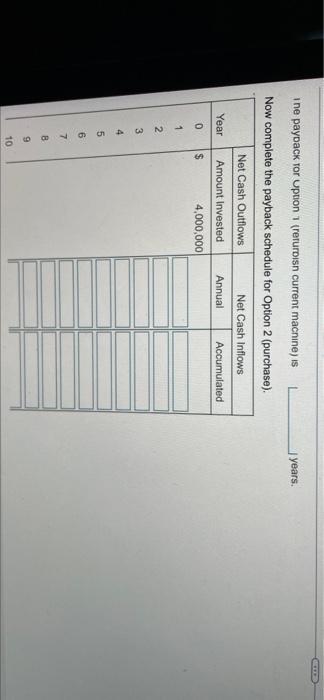
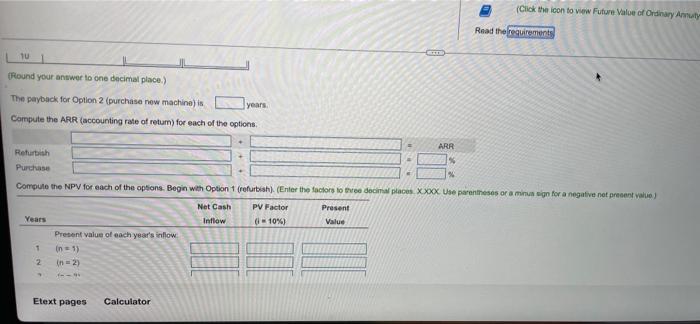
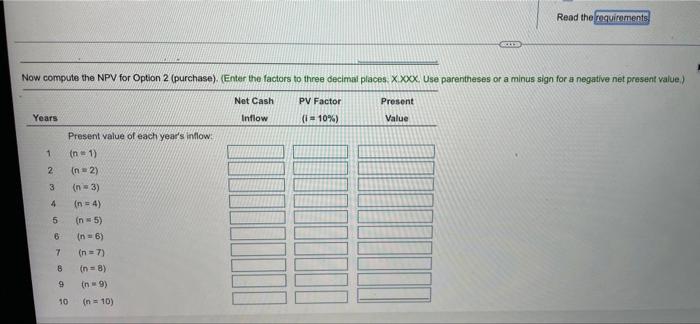
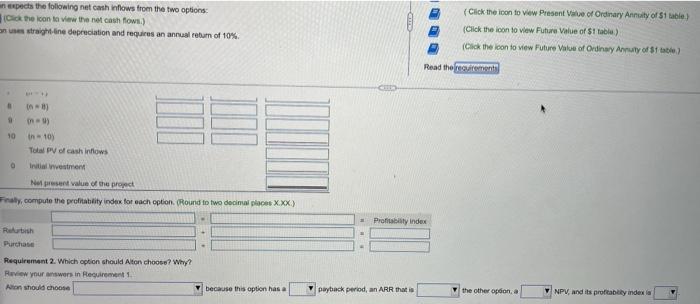
Requirement 1. Compute the payback, the ARR, the NPV, and the profitability index of these two options, Compute the payback for both options. Begin by completing the payback schedule for Option 1 (refurbish) Net Cash Outflows Amount Invested Net Cash Inflows Annual Accumulated Year 0 $ 2,000,000 1 2 3 44 5 6 7 8 (Round your answer to one decimal place.) (Click the icon to view Future Value of Ordinary Annuity of $1 table) More info - X PV, and the pro leting the payba The company is considering two options. Option 1 is to refurbish the current machine at a cost of $2,000,000. If refurbished, Alton expects the machine to last another eight years and then have no residual value. Option 2 is to replace the machine at a cost of $4,000,000. A new machine would last 10 years and have no residual value. ws cumulated Print Done two options: Data table annual return of 10% - Xew Present Value of Ordinary Annuity of 51 table) iew Future Value of $1 table.) iew Future Value of Ordinary Annuity of $1 table.) Purchase New Machine 3,600,000 430,000 360,000 Refurbish Current Machine $ 1,470,000 $ Year Year 1 Year 2 he NPV, and the profitability indes ompleting the payback schedule Intlows Accumulated Year 3 Year 4 Year 5 Year 6 340,000 270,000 200,000 130,000 130,000 130,000 130,000 Year 7 Year 8 290,000 220,000 220,000 220,000 220,000 220,000 220,000 Year 9 Year 10 $ 2,800,000 $ 6,000,000 Total Reference Next question acturing vormat nown tre uh fows and requi of S1 table $1 table) back, the A on. Begin Net Annual Present Value of $1 Periods 1% 2% 3% 4% 5% 6% 7% 8% 9% 10% 12% 14% 15% 16% Period 1 15% 205 0.990 0,980 0.971 0962 0.952 094309350.526 0.917 0.909 0.93 0.877 0.870 0362 0.4703 Period 2 0.9600.961 0.943 0.925 0.907 0 290 0.873 0.857 0.8420828 0.797 0.769 0.756 0.743 0718 0.094 Period 3 0.971 0.942 0.915 0.889 0.864 0.840 0.816 0.794 0.772 0.750 0.712 0.875 0.6580541 0.609 0.579 Period 4 0.961 0324 0.888 0855 0.8230.792 0.763 0735 0708 0.68 0.636 0.592 0.572 0.55205160482 Periods 0.951 0.906 0.863 0.22 0.700.747 0.71306810650 0.621 0.5670519040704760437 0.402 Period 6 0.942 0.8880.837 0.790 0.746 0.705 0.865 0.630 0506 0.54 0.57 0.436 042 0410 0.370 0.335 Period 7 0.933 0.871 0.813 0.7600.11 0.665 0.023 0.583 0.547 05130452 0.400 0378 0.354 0.14 0.279 Period & 0923 0.853 0.789 0.731 0.677 0.027 0.5820.540 0.50 0.7 0.4040351 0.27 0.305 0.256 0233 Perlod 9 0.914 08370.700.70308450.502 0.5440.500 0.460 0.44 0.36 0.308 0.254M00.250.194 Period 10 0.905 0.820 0.744 0.676 0.8140558 0.508 0.463 0422 0.96 0.322 0.2700-2470.221 0.100.102 Period 11 0.896 0.80407220.6500.550.5270475 0.429 0.3880.350 0.287 0.237 0.215 0.1950 1620135 Period 12 0.887 0.788 0.701 0.625 0.567 0497 0.4440.397 0.356 03190257 0.200 0.1870, 1600,137 0.112 Period 13 0.879 0.773 0.681 0.601 0.530 0.409 0.415 0.38 0.32602900229 0.1820.1600.450.11 0.093 Period 14 0.870 0.750 0.861 0.577 0.505 0.442 0.3880340 0.250 0.20 0.205 0.100.141 0.125 0.0990078 Period 15 0.861 0.743 0542 0.556 0.481041720 315 0275 0.239.100.1400 1230 100004 0.065 Period 16 0853 0.7280.823 0.53404580394 03390 212 0252 0.218 0.1630123 0.407 0.00 0.0710054 Period 17 0.844 0.714 0.005 0.5130436 0.371 0.3170270 0237 0.19 0.146 0.10 0.00 0.00 0.00 0.045 Period 18 0.836 0.700 0.587 0.4940416 0.350 0296 0.250 0212 0.180.130 0.09 0.08 0.09 0.051 0.038 Period 19 0828 0.886 OSTO 047503160331 0.277 0232 0.11 0.164 0.116 0.00 0.000 0.00 0.00 0.001 Period 20 0.3200073 0.5540.456 0377 0.312 0.258 0215 0.178 0.100.104 0.073 0.00 0.05 0.0 0.126 0.19 0.140.135 0.003 0.05 0.06 0.00001 00:22 Period 21 0.81 0.660 0.538 0.439 03690294 0.242 Period 22 0.803054705220422 0.3420278 0.225 0.14 0.50 0.123 0.003 0.06 0.046 0.00 0.00 0.018 Period 23 10.795 0.6340 507 0.4060.326 0.22 0.211 0.1700.138 0.112 00 0.00 0.00 0.022 0.015 onal informatie ash inflows tre et cash flows ation and requi of 1 table) stable) payback, the AB options. Begin Present Value of Ordinary Annuity of St Periods 1% 2% 3% 4% 5% 6% 7% 8% 99 10% 12% 14% 15% 16% 18% 20% Period 1 0.900 0.98009710.962 0.962 0943 0.905 0.926 09170.909 08930.877067008620847083 Period 2 1970 1942 1.9131886 1859 1833 18081.783 1.750 1.736 1690 16471.625 1.605 1.566 1525 Period 3 2.9412.8842829 2.775 2.723 2.673 2624 2577 2531 2487 2.4022322 223 2246 2174 2.106 Period 4 3.902 3.808 3.717 3630 3.546 3.46533873.312 3240 3.170 3.037 2914 285 286 2690 2589 Periods 4853 4.713 4.580 4.452 4.3294212 4.100 3.9933.890 3.791 3.6053433 3.362 3.274 3.127 2.991 Period 5.795 5.601 5.417 5242 5076 4.917 4.767 4.623 4.486 4355 4.111 3889 3784 365 3498 3.328 Period 7 6.728 6.472 6.2308002 5.788 5.582 5.389 5.20 5033486845644.286416040093812 3.60 Period 8 7.652 7.32570206.733 6.463 6.210 5.971 5.747 6.535 5335 4.968 469 4487 4344 4.078 3.837 Period 9 8.5668.1627.785 7.435 7.108 6.802 6.515 6.247 5.905 5.750 5.32849464.7724.60743034031 Period 10 9.4718.9838.530 8.111 7.722736070246.710 6418 6145 5.650 5216 5.019 48334414182 Period 11 10.368 9.787 9.2538.70083007.887 7.499 7.139 6.0 6495 59335.453 624 6.0294856 4127 Period 12 11.255 10.575 9.9549.38538638.3847437.536 7.1616161945.60 5.42151974.7904439 Period 13 12.134 11.348 10.6359.986 9.3948.8538.358 7.90474577.10364246.8425.583 53624910 4.630 Period 14 13.004 12.000 11.296 10.5839.800 9.2958.7456.2447.78673876.9286.002 5.72454646.0084611 Period 15 13 865 12.840119381111810.3809712 9.108 8.5598081 7600681161425.847 6.575.000 46015 Period 16 14.718 13.57812561 11.852 10.838 10.160 9447 8.451831372046.9746245 5.954 566 5.1624.730 Period 17 15.50214292 13.166 12.560 11.274 104770.763 9.122.544 3.02271206.37360475.79 5.222 4.775 Period 18 16.396 14.992 13.754 12.650 1.500 10.00 10.059 3.3728.756.2017.250 647 6.1255818 2734312 Period 19 17.226 15.678 14,324 13.134 12.085 11.15 10 3360.604 8.50 8.25 7.3666550 6.195.877.3164844 Period 20 18.046 16.35114877 13.500 1262 11.470105949.818 9.1298514746.629 6.250 5.509 53534870 Period 21 18.867 17.01115415 14.029 12.621 11.764 10.836 10 DIT 9.250 6.6497.526.6876.312.5.3844191 Period 22 19.050 17.658 1593714451 13.163 12012 11 10 2019.4428772 7.645 613 6.3508015410409 Period 23 20.456 18 292 16.444 54.857 13.480 12.303 11 272 103719508.883 7.718 6792 8.30 5.044 5432425 Net Annual 000 Print Done y Annulty of $1 table) sh inflows from the cash flows) on and requires an ar Annuity of 51 table ayback, the ARR, the N options. Begin by comp Periods Period 1 Period 2 Period 3 Period 4 Periods Periodo Period 7 Period & Period Period 10 Period 11 Period 12 Period 13 Period 14 Period 15 Period 16 Period 17 Period 18 Period 19 Period 20 Period 21 Period 22 Period 23 Future Value of $1 1% 25 3% 4% 5% 6% 7% -3% 9% 10% 12% 16% 15% 1,010 1.020 1.000 1.000 1.050 1.000 1.070 1080 1.090 1.100 1.120 1.100 1.150 1.020 1.040 1061 1012 1.100 1.1241.145 1.166 1.18812101254301323 1030 1061 1.093 1.125 1.1581.1911225 1.250 1.2951331 140514821521 1.041 1.0821.126 1.170121612021.3111.300 14121464 1.574 1.6991749 1.061 1.104 1.159 1.2171270 1.338 1.400 1.469 1.539 1.611 1762 1925 2011 1.062 1.126 1.194 1255 1340 14191501 1.587 1.677 1772 1.9742.1952 313 1.072 1.14912301.316 1.407 1.5041.3061.7141.28 1.949 2211 2512 2.600 1,083 1.1721.28713691477 1.554 1718 1.851 1.98021442476 2850 3.069 1.0944 1.195 1.36 1423 1.551 1.601838 1.990 2.172 2368 277332523.518 1.105 1219 1.3441481629119119572.150 2.367 2.54 1105 2.707 4045 1.116124313841.599 1710 1.898 2.105 2332 2.580 2.83 3.479 4.2264.652 1.1271.2581426 1601 1.796 2012 2252 2518 2813 3.1343896 4818 5.350 1.1381214 1400109588621332410 2720 3.00 3.452 4.05.426153 1,1491.319 1.5131732 1.960 2251 2529 2907 3.342 3.798 4762017.075 1.1611155818012079 239 2.750 3.1723.64241776.4747.438 137 11731373 16051873 2.183 254029623.420 3.70 45956.130 8.137 3.558 1.184 14001663 1948 2.292 2.0933.1593.700 42850546.669.278 1076 1.196 1428 1.702 2.25 2.40728543.380 3.996 47175.5607.000 10.58 12.30 12081457 1.7542107 2.527 30263.61743161426.116861312061423 1637 1.720 1.4861.82.1912.653 3.20738704661 56046.7279548 123215161.1602279 2785 3.400 4.1415.034 6.100 1.400 10.80 1567182 1 245 1546 916 237029253.804 4430543766508.140 12.10 17.0 154 1257577 1974 2485 2.07238204741 5.6717238 8.164 13:55 20:38 Net Cash into Annual Print Done test Annuity of 51 table cash inflows from the tw et cash flows) ation and requires an an Annuity of $1 table) payback, the ARR, the N h options. Begin by compl Periods Period 1 Period 2 Period 3 Period 4 Perlod 5 Period 6 Period 7 Period 8 Period 9 Period 10 Period 11 Period 12 Period 13 Period 14 Period 15 Period 16 Period 17 Period 18 Period 19 Period 20 Period 21 Period 22 Period 23 Future Value of Ordinary Annuity of $1 1% 2% 3% 4% 5% 6% 7% 8% 9% 10% 125 14% 15% 1.000 1.000 1.000 1.000 1.000 1.000 1.000 1.000 1.000 1.000 1.000 1.000 1.000 2010 2020 2.000 2040 2050 2050 2.070 080 2090 2100 2.1202140 2.150 3.0303.0603.0013.122 3.153 3.1843.215 3.246 3.278 3.310 3.3743.440 3.473 40604.1224184424643104375 4.440 45064.573 4641477949214993 5.101 5.2045.309 5.416 5526 5.6375.7515.8675.985 6.106 6.353 6.610 6.742 6.152 6.308 64686.630 68026.9757.153 7338 7.523 7.716 8.115 8.536 8.754 72147434768278988.542 8.39486546.9239.2009.467 10.09 10.73 11.07 8286 8.5838.89292149.549 9.897 10.250 1064 11.03 11.44 12.30 13.23 1373 9.369 9.756 10.16 105811.00 11.49 11.98 12.49 13.02 13.58 1478 1809 16.79 1046 109511.46 1201 1258 18.18 | 1382 1449 15.1915.94 1755 1934 20.30 11.57 | 12:17 1281134014211497 1578 16,65 17.56 18.53 2065 23.0424.35 12.68 13:41 14 1915031592 16.87 17.8918.98 20.14213824.13 27.27 29.00 13.81 14.681562 16.63 1771 18.86 20.14 21.50 22.952452 28.0332003438 14951597170918.2919.60 21.02 22.5 2421 26.02 27.12.39 37584050 16.10 17.29 1860 20.02 21582328 25.13 27.15 29.3631773728 438 47.5 1726 1864 20.16 21.822366 25.67 27.8030.3233.00 3595 12.750.855.72 18.43 2001 2176 23.702584 282130433.75 3697|4054 488 58.1265.08 19.61 2141 23.41 25.68 28.13 30.9134.00 3745 41.3045.60 557568.97584 2081 2284 25.12 27.57 30.54 33.78 373 4145 45.02 51.1663.44789768.21 22.02 2430 28.87 29.7833.07 10.79 4100 45.78 51.16572872059102104 23 24 25.78 28.631.97 3572 39.99 44B750.4256.78 54.008170104818.3 2447 27.30 30.543425 38.51 433949.01 55.40 6287 71.40 12.50 1204 137.6 25.72 28.85 324533.62 4143 4700 53.4460.89 69.5 79.54 1046 13031503 Net Cash Info Annual Accu 000 Print Done or mary Annuity of $1 table.) Read the requirements - Requirements PV, and the prd ating the payba 1. Compute the payback, the ARR, the NPV, and the profitability index of these two options. 2. Which option should Alton choose? Why? ws umulated Print Done i ne paypack for Uption 1 (returis current machine) is years. Now complete the payback schedule for Option 2 (purchase). Net Cash Outflows Net Cash Inflows Annual Accumulated Year Amount Invested 0 $ 4,000,000 1 2 3 4 5 6 7 B 9 10 (Click the icon to view Future Value of Ordinary Anuty Read the requirements 10 Round your answer to one decimal place.) The payback for Option 2 (purchase new machine) is years Compute the ARR (accounting rate of return) for each of the options ARR Refurbish Purchase 24 Compute the NPV for each of the options. Begin with Option 1 refurbish) (Enter the factors to three decimal places Xxxx Use parentheses or a minus in for a negative not present value Net Cash PV Factor Present Years Inflow (-10%) Value Present value of each year's inflow 1 in = 1) 2 in=2) Etext pages Calculator Read the requirements Now compute the NPV for Option 2 (purchase). (Enter the factors to three decimal places. Xxxx Use parentheses or a minus sign for a negative net present value) Net Cash PV Factor Present Value Years Inflow (1 = 10%) Present value of each year's inflow: 1 In 1) 2 (n=2) 3 (n = 3) 4 (n = 4) 5 (n = 5) 6 in 6) 7 (n=7) B in = 8) 9 in 9) 10 (n = 10) an expects the following net cash flows from the two options the icon to view the net cash flow.) s straight line depreciation and requires an annual return of 10% (Click the icon to view Present Value of Ordinary Annualty of S1 table) (Click the icon to view Future Value of $1 tabla) (Click the icon to view Future Value of Ordinary Annuity of State) Read the remonts - 10 ) tn 10) Total PV of cash inflows Initial investment Neprest value of the project Faly, compute the profitability index for each option. Round to two decinul places X.XX.) Profitability index Relatih Purchase Requirement 2. Which option should Alton choose? Why? Review your answers in Requirement1 Aron should choose because this option has a payback period, an ARR that is the other option W NPV, and its profitably index la
