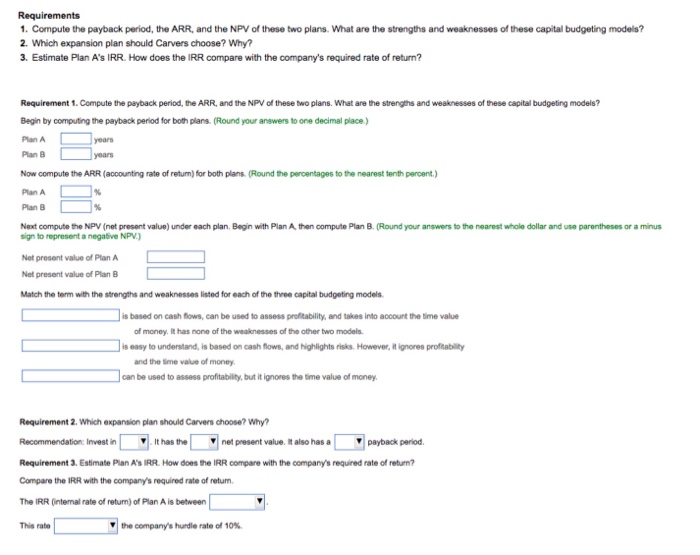
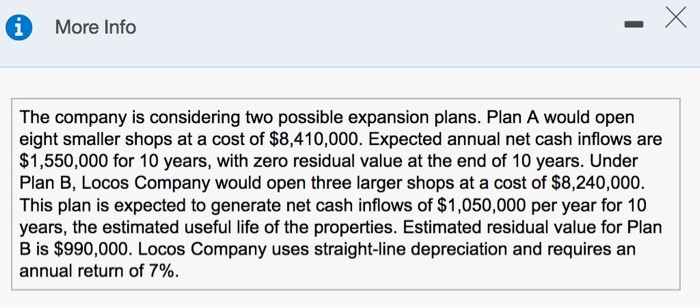
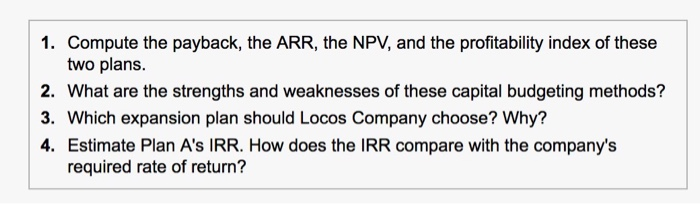
Requirements 1. Compute the payback period, the ARR, and the NPV of these two plans. What are the strengths and weaknesses of these capital budgeting models? 2. Which expansion plan should Carvers choose? Why? 3. Estimate Plan A's IRR. How does the IRR compare with the company's required rate of return? Requirement 1. Compute the payback period, the ARR, and the NPV of these two plans. What are the strengths and weaknesses of these capital budgeting models? Begin by computing the payback period for both plans. (Round your answers to one decimal place) Plan A D Plan B Now compute the ARR (accounting rate of return) for both plans. (Round the percentages to the nearest tenth percent.) Plan A Plan B Next compute the NPV (net present value) under each plan. Begin with Plan A then compute Plan B. (Round your answers to the nearest whole dollar and use parentheses or a minus sign to represent a negative NPV.) Net present value of Plan A Net present value of Plan B Match the term with the strengths and weaknesses listed for each of the three capital budgeting models is based on cash flows, can be used to assess profitability, and takes into account the time value of money. It has none of the weaknesses of the other two models is easy to understand, is based on cash flows, and highlights risks. However, it ignores profitability and the time value of money can be used to assess profitability, but it ignores the time value of money Requirement 2. Which expansion plan should Carvers choose? Why? Recommendation: Invest in it has the net present value. It also has a payback period, Requirement 3. Estimate Plan A's IRR. How does the IRR compare with the company's required rate of return? Compare the IRR with the company's required rate of return The IRR (internal rate of return) of Plan A is between This rate the company's hurdle rate of 10% i More Info The company is considering two possible expansion plans. Plan A would open eight smaller shops at a cost of $8,410,000. Expected annual net cash inflows are $1,550,000 for 10 years, with zero residual value at the end of 10 years. Under Plan B, Locos Company would open three larger shops at a cost of $8,240,000. This plan is expected to generate net cash inflows of $1,050,000 per year for 10 years, the estimated useful life of the properties. Estimated residual value for Plan B is $990,000. Locos Company uses straight-line depreciation and requires an annual return of 7%. 1. Compute the payback, the ARR, the NPV, and the profitability index of these two plans. 2. What are the strengths and weaknesses of these capital budgeting methods? 3. Which expansion plan should Locos Company choose? Why? 4. Estimate Plan A's IRR. How does the IRR compare with the company's required rate of return? Periods Present Value of Ordinary Annuity of $1 1% 2% 3% 4% 5% 6% 7% 8% 9% 10% 12% 14% 15% 16% 18% 20% 0.990 0.980 0.971 0.962 0.952 0.943 0.935 0.926 0.917 0.909 0.893 0.877 0.870 0.862 0.847 0.833 1.970 1.942 1.913 1.886 1.859 1.8331.8081.783 1.759 1.736 1.6901.6471.6261.605 1.566 1.528 2.9412.884 2.829 2.775 2.723 2.673 2.624 2.577 2.531 2.487 2.402 2.322 2.283 2.246 2.174 2.106 3.902 3.808 3.717 3.630 3.546 3.465 3.387 3.312 3.240 3.170 3.037 2.914 2.855 2.798 2.690 2.589 4.853 4.713 4.580 4.452 4.329 4.212 4.100 3.993 3.890 3.791 3.605 3.433 3.352 3.274 3.127 2.991 5.795 5.601 5.417 5.2425.076 4.917 4.767 4.623 4.4864.355 4.111 3.889 3.784 3.685 3.498 3.326 6.728 6.472 6.230 6.002 5.786 5.582 5.389 5.206 5.033 4.868 4.564 4.288 4.160 4.039 3.812 3.605 7.652 | 7.325 7.020 6.733 6.463 6.210 5.971 5.7475 .535 5.335 4.9684.6394487 4.344 4.078 3.837 8.566 8.162 7.786 7.435 7.108 6.802 6.515 6.247 5.9955.759 5.328 4.9464.772 4.607 4.303 4.031 9.471 8.983 8.530 8.1117.722 7.360 7.024 6.710 6.418 6.145 5.6505.216 5.019 4.833 4.494 4.192 10.368 9.787 9.2538.760 8.306 7.887 7.499 7.139 6.805 6.495 5.938 5.453 5.234 5.029 4.656 4.327 11.255 10.575 9.9549.3858.863 8.384 7.943 7.536 7.1616.814 6.194 5.660 5.421 5.197 4.793 12.134 11.348 10.635 9.9869.3948.853 8.358 7.9047.487 7.103 6.424 5.842 5.583 5.3424.910 4.533 13.004 12.106 11.296 10.563 9.899 9.295 8.745 8.244 7.786 7.367 6.628 6.002 5.724 5.468 5.008 4.611 13.865 12.849 11.938 11.118 10.380 9.712 9.108 9.108 8.559 8.061 7.606 6.811 6.142 5.847 5.575 5.092 4.675 14.718 13.578 12.561 11.652 10.838 10.106 9.447 8.851 8.313 7.8246.9746.265 5.954 5.669 5.1624.730 15.562 14.292 13.166 12.166 11.274 10.477 9.763 9.122 8.544 8.022 7.120 6.373 6.047 5.749 5.222 4.775 16.398 14.992 13.754 12.659 11.690 10.828 10.059 9.372 8.756 8.201 7.250 6.467 6.128 5.818 5.273 4.812 17.226 15.678 14.324 13.134 12.085 11.158 10.336 9.604 8.950 8.365 7.366 6.550 6.198 5.877 5.316 4.844 18.046 16.351 14.877 13.590 12.462 11.470 10.594 9.818 9.129 8.5147.469 6.623 6.259 5.929 5.353 4.870 4.439 Periods 15% 1.000 2.150 3.473 1% 1.000 2.010 3.030 4.060 5.101 6.152 7.214 8.286 9.369 10.46 11.57 12.68 13.81 14.95 16.10 17.26 18.43 19.61 20.81 22.02 Future Value of Ordinary Annuity of $1 2% 3% 4% 5% 6% 7% 8% 9% 1.000 1.000 1.000 1.000 1.000 1.000 1.000 1.000 2.020 2.030 2.040 2.050 2.060 2.070 2.080 2.090 3.060 3.091 3.122 3.153 3.184 3.215 3.246 3.278 4.122 4.1844.246 4.310 4.375 4.440 4.506 4.573 5.204 5.3095.416 5.526 5.637 5.7515.867 5.985 6.308 6.4686.633 6.802 6.975 7.1537.336 | 7.523 7.4347.6627.898 8.142 8.394 8.654 8.923 9.200 8.583 8.8929.2149.549 9.897 10.260 10.64 11.03 9.755 10.16 10.58 11.03 11.49 11.98 12.49 13.02 10.95 11.46 12.01 12.58 13.18 13.82 14.49 15.19 12.17 12.81 13.49 14.21 14.97 15.78 16.65 17.56 13.41 14.19 15.03 15.92 16.87 17.8918.98 20.14 14.68 15.62 16.63 17.71 18.88 20.14 21.50 22.95 15.97 17.09 18.29 19.60 21.02 22.55 | 24.21 26.02 17.29 18.60 20.02 21.58 23.28 25.13 27.15 29.36 18.64 20.16 21.82 23.66 25.67 33.00 20.01 21.76 23.70 25.84 28.21 30.84 33.75 36.97 21.41 23.41 25.65 28.13 30.91 37.45 41.30 22.84 25.12 27.67 30.54 33.76 37.38 41.45 46.02 24.30 26.87 29.78 33.07 36.79 41.00 45.76 51.16 10% 12% 1.000 1.000 2.100 2.120 3.310 3.374 4.641 4.779 6.105 6.353 | 7.716 8.115 9.487 10.09 11.44 12.30 13.5814.78 15.94 17.55 18.53 20.65 21.38 24.13 24.52 28.03 27.98 32.39 31.77 37.28 35.95 42.75 40.54 48.88 45.60 55.75 51.16 63.44 57.28 72.05 14% 1.000 2.140 3.440 4.921 6.610 8.536 10.73 13.23 16.09 19.34 23.04 27.27 32.09 37.58 43.84 50.98 59.12 68.39 78.97 91.02 4.993 6.742 8.754 11.07 13.73 16.79 20.30 24.35 29.00 34.35 40.50 47.58 55.72 65.08 75.84 88.21 102.4