Answered step by step
Verified Expert Solution
Link Copied!

Question

1 Approved Answer

Requirements 1. How much out-of-pocket cash will you invest under the two options? 2. How much savings will you have accumulated at age 53 under

image text in transcribedimage text in transcribedimage text in transcribedimage text in transcribedimage text in transcribedimage text in transcribed

Requirements 1. How much out-of-pocket cash will you invest under the two options? 2. How much savings will you have accumulated at age 53 under the two options? 3. Explain the results. 4. If you let the savings continue to grow for nine more years (with no further out-of-pocket investments), under each scenario, what will the investment be worth when you are age 62? Print Done Assume you want to retire early at age 53. You plan to save using one of the following two strategies: (1) save $4,500 a year in an IRA beginning when you are 28 and ending when you are 53 (25 years) or (2) wait until you are 43 to start saving and then save $11,250 per year for the next 10 years. Assume you will earn the historic stock market average of 12% per year. Click the icon to view the future value annuity factor table.) (Click the icon to view the future value factor table.) (Click the icon to view the present value annuity factor table.) (Click the icon to view the present value factor table.) Read the requirements Requirement 1. How much out-of-pocket cash will you invest under the two options? Calculate how much out-of-pocket cash you will invest under the two options Option 1:$ Reference Future Value of Annuity of $1 1000 2120 3405.0661.154 2.060 4.246 5.309 5.416 5.526 10.08910.730 11.414 12.14212.916 9.89710.63711.436 12.300 13.23314.240 15.327 16.499 9.75510.159 10.583 11.02711.491 12.488 13.57914.776 16.085 17.51919.086 20.799 10.46210.950 11.464 12.00612.57813.181 14.48715.937 17.54919.337 21.321 23.52125.959 11.56712.169 2.808 13.48614.207 14.97216.64518.531 20.655 23.04525.733 28.75532.150 34.931 39.581 13.80914.680 5.618 16.62717.713 18.882 21.49524.523 28.02932.08936.786 42.21948.497 14.947 15.97417.086 18.29219.59921.015 24.215 27.97532.39337.58143.672 50.818 59.196 16.09717.29318.599 20.02421.57923.276 27.152 31.772 37.28043.84251.660 60.965 72.035 22.01924.29726.87029.77833.06636.78645.762 57.275 72.05291.025 115.380 146.628 186.688 28.24332.030 36.45941.646 47.72754.865 73.106 98.347133.334181.871 249.214 342.603 471.981 9.214 0 27.27130.850 12.683 13.412 14.192 15.02615.917 16.870 18.97721.384 24.13327.271 1 2 34.78540.56847.57556.08566.439 79.058113.283 164.494241.333356.787 530.312 790.9481,181.882 48.886 60.40275.401 95.026 120.800 154.762 259.057442.593 767.0911,342.0252,360.7574,163.213 7,343.858 1 Print Done Reference Present Value of Annuity of $1 Periods | 1% | 2% | 3% | 4% | 5% | 6% | 8% | 10% | 12% | 14% | 16% | 18% | 20% 10.990 0.9800.9710.9620.9520.943 0.9260.909 0.8930.877 0.862 0.8470.833 2 1.970 1.9421.9131.88618591.833 1.783 1.736 1.690 1.647 1.6051.5661.528 3 2.9412.884 2.829 2.775 2.723 2.673 2.577 2.487 2.402 2.322 2.246 2.1742.106 43.902 3.8083.7173.6303.5463.4653.312 3.1703.0372.9142.7982.690 2.589 5 4.8534.713 4.5804.452 4.329 4.212 3.993 3.7913.605 3.433 3.2743.127 2.991 6 5.7955.601 5.4175.242 5.076 4.917 4.6234.355 4.111 3.8893.6853.498 3.326 7 6.7286.4726.2306.0025.7865.5825.2064.8684.5644.2884.0393.8123.605 8 7.652 7.325 7.020 6.733 6.463 6.210 5.7475.3354.968 4.6394.3444.078 3.837 9 8.5668.1627.7867.435 7.1086.802 6.2475.7595.3284.946 4.607 4.3034.031 10 9.4718.9838.530 8.117.7227.3606.710 6.145 5.650 5.216 4.8334.4944.192 1110.3689.7879.2538.7608.306 7.887 7.139 6.4955.9385.453 5.029 4.656 4.327 12 11255 10.575 9.9549.3858.863 8.3847.5366.814 6.1945.6605.1974.7934.439 13 12.134 11.348 10.635 9.9869.3948.8537.9047.103 6.4245.842 5.3424.910 4.533 14 13.004 12.106 11.296 10.563 9.8999.2958.2447.367 6.628 6.0025.4685.0084.611 15 13.865 12.849 11.938 11.118 10.380 9.712 8.5597.606 6.8116.142 5.575 5.092 4.675 20 18.046 16.35114.877 13.59012.462 11.4709.818 8.514 7.4696.6235.9295.3534.870 25 22.023 19.523 17.413 15.622 14.094 12.783 10.675 9.077 7.843 6.873 6.097 5.4674.948 30 25.808 22.39619.600 17.29215.372 13.765 11.2589.427 8.0557.003 6.177 5.5174.979 4032.835 |27.35523.115 19.793 17.15915.046 11.925 9.7798.2447.1056.2335.5484.997 Done Print 997 86 0-2 4 704 9531-49 211122 23456 78 49684 3 36 3 025 6 74 3918 19 36 11 26 239 8 1 3692 71742 125 6831 7668 -1388 4 19892 7 488 905 148 81 482 2 00295 52327 68218 550 21963 4-1 3469 15827 28421 40882 9 001 5 12457 92471 48384 7 223 33445 9 9 135 81471 7 06009 74199 28 866 80 I 04128 9 62963 I 91 82317 723 89 91369 094 8 3 45567 801 6 2 01369 925 075 6938 6 6 6 445 3 0 2 0012 69259 38 24791 46 96 6118 2 0 0 0 0 1 11-12 2223 2 0 12345 0500 1 2 3 4 5 6789 Reference Present Value of $1 Periods | 1% | 2% | 3% | 4% | 5% | 6% | 8% | 10% | 12% | 14% | 16% | 18% | 20% 1 0.990 0.9800.9710.9620.9520.9430.926 0.9090.8930.877 0.862 0.847 0.833 2 0.9800.961 0.943 0.925 0.907 0.890 0.857 0.826 0.797 0.7690.743 0.718 0.694 3 0.9710.942 0.915 0.8890.8640.840 0.7940.7510.712 0.675 0.6410.609 0.579 40.9610.924 0.888 0.855 0.823 0.7920.7350.6830.636 0.592 0.552 0.516 0.482 5 0.9510.906 0.8630.8220.7840.747 0.6810.6210.5670.519 0.4760.4370.402 6 0.942 0.888 0.8370.790 0.746 0.705 0.630 0.5640.507 0.456 0.410 0.370 0.335 7 0.9330.871 0.813 0.760 0.7110.6650.5830.513 0.452 0.400 0.3540.314 0.279 8 0.923 0.8530.7890.731 0.677 0.627 0.540 0.467 0.4040.351 0.305 0.266 0.233 90.9140.837 0.7660.7030.6450.592 0.500 0.4240.3610.3080.2630.2250.194 10 0.9050.820 0.7440.676 0.6140.5580.463 0.386 0.322 0.270 0.227 0.1910.162 110.8960.8040.7220.6500.5850.527 0.4290.350 0.287 0.237 0.1950.1620.135 12 0.887 0.788 0.701 0.625 0.557 0.497 0.397 0.319 0.257 0.208 0.168 0.137 0.112 13 0.8790.7730.6810.601 0.530 0.4690.3680.2900.2290.1820.1450.1160.093 14 0.870 0.7580.6610.577 0.505 0.442 0.340 0.263 0.205 0.160 0.125 0.0990.078 15 0.8610.7430.642 0.5550.4810.4170.3150.2390.1830.1400.1080.0840.065 200.820 0.673 0.5540.456 0.377 0.312 0.215 0.149 0.104 0.073 0.051 0.037 0.026 250.7800.6100.4780.375 0.2950.2330.1460.092 0.059 0.0380.0240.0160.010 30 0.742 0.552 0.412 0.308 0.231 0.1740.0990.057 0.033 0.020 0.012 0.007 0.004 400.672 0.4530.3070.2080.142 0.0970.046 0.022 0.0110.005 0.0030.001 0.001

Step by Step Solution

There are 3 Steps involved in it

Step: 1

blur-text-image

Get Instant Access to Expert-Tailored Solutions

See step-by-step solutions with expert insights and AI powered tools for academic success

Step: 2

blur-text-image

Step: 3

blur-text-image

Ace Your Homework with AI

Get the answers you need in no time with our AI-driven, step-by-step assistance

Get Started

Recommended Textbook for

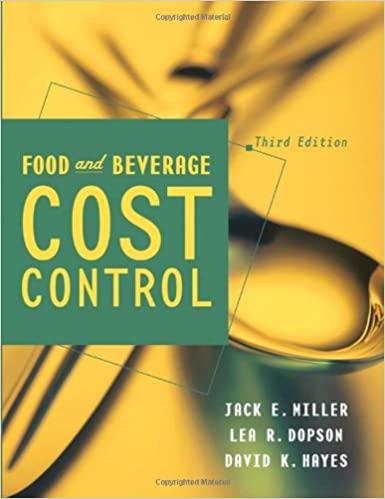
Food And Beverage Cost Control

Authors: Jack E. Miller, Lea R. Dopson, David K. Hayes

3rd Edition

0471273546, 978-0471273547

More Books

Students also viewed these Accounting questions

Question

Understand the post-crisis debate on HRM and pedagogy

Answered: 1 week ago