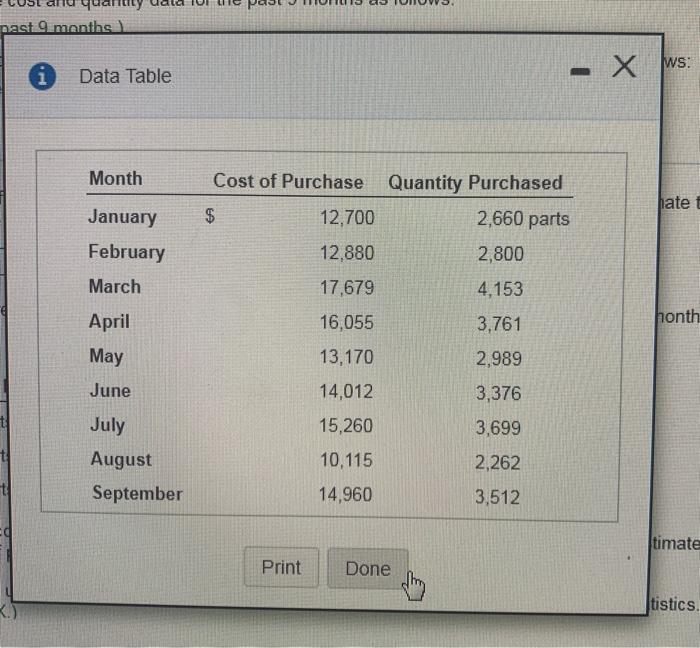
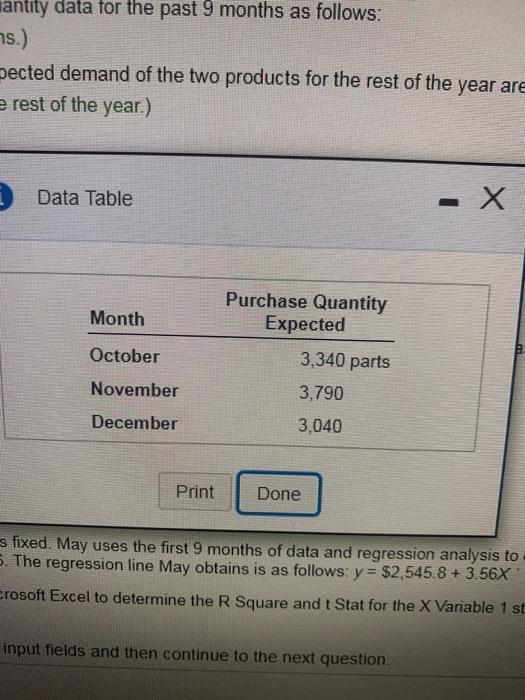
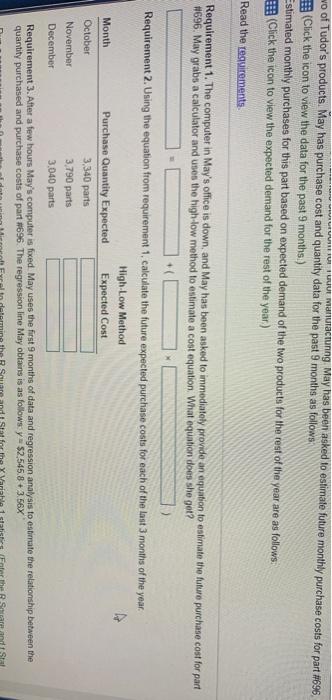
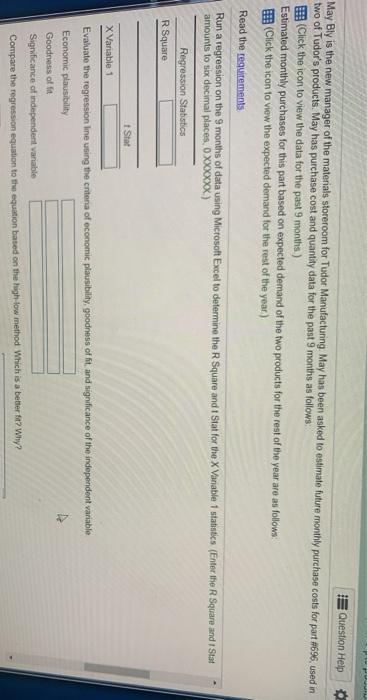
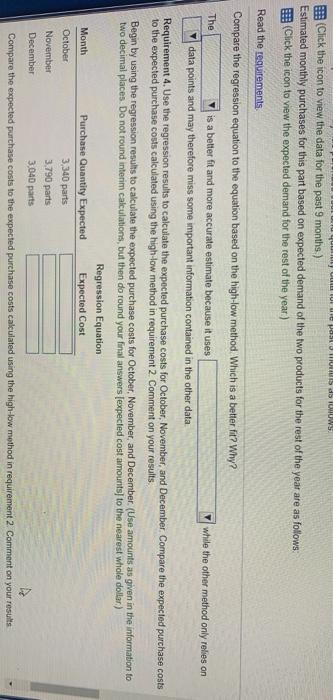
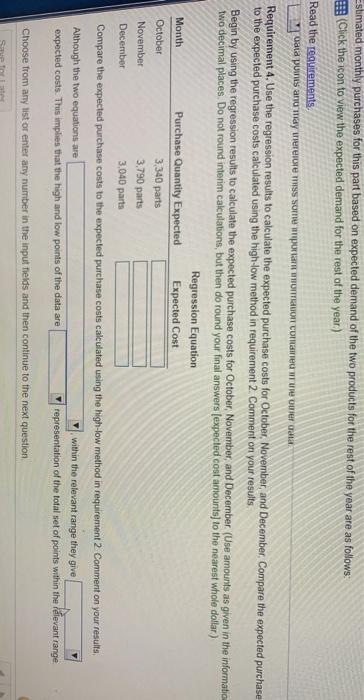
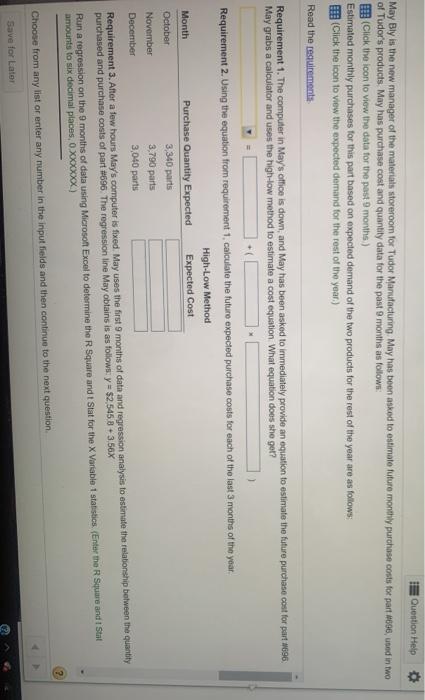
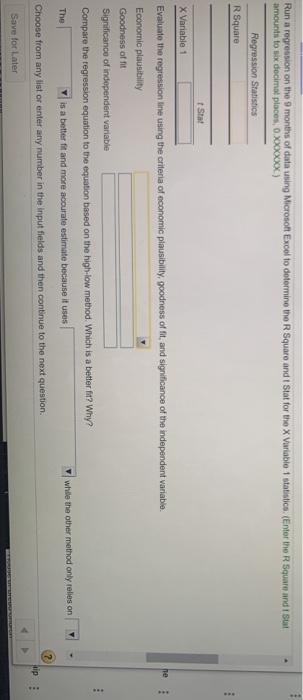
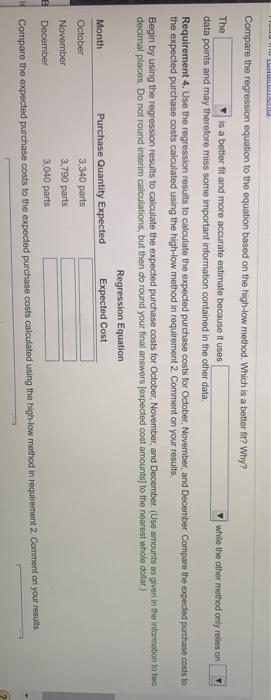
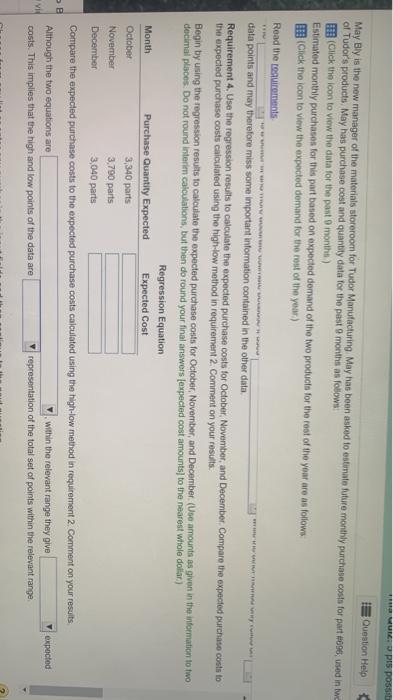
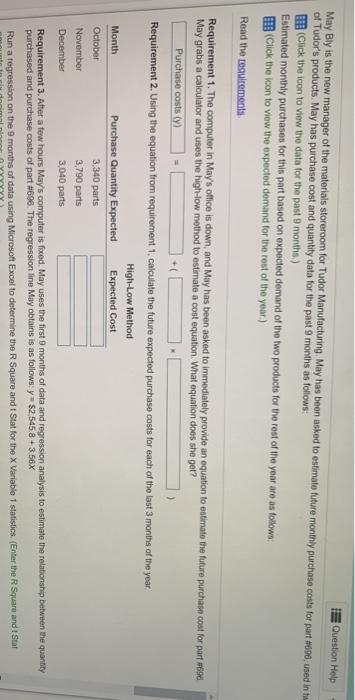
* Requirements 1. The computer in May's office is down, and May has been asked to immediately provide an equation to estimate the future purchase cost for part #696. May grabs a calculator and uses the high-low method to estimate a cost equation. What equation does she get? 2. Using the equation from requirement 1, calculate the future expected purchase costs for each of the last 3 months of the year. 3. After a few hours May's computer is fixed. May uses the first 9 months of data and regression analysis to estimate the relationship between the quantity purchased and purchase costs of part #696. The regression line May obtains is as follows: y = $2.545.8 +3.56X Evaluate the regression line using the criteria of economic plausibility, goodness of fit, and significance of the independent variable Compare the regression equation to the equation based on the high-low method Which is a better fit? Why? 4. Use the regression results to calculate the expected purchase costs for October, November, and December. Compare the expected purchase costs to the expected purchase costs calculated using the high-low method in requirement 2. Comment on your results. 54 COS of Print Done nast 9 months Data Table X ws: Month hate t January February Cost of Purchase Quantity Purchased $ 12,700 2,660 parts 12,880 2,800 March 17,679 4,153 honth April May 16,055 13,170 3,761 2,989 June 14,012 3,376 15,260 3,699 July August September 10.115 2,262 t 14,960 3,512 timate Print Done tistics. antity data for the past 9 months as follows: ns.) Dected demand of the two products for the rest of the year are e rest of the year.) Data Table - Month October Purchase Quantity Expected 3,340 parts 3,790 3,040 November December Print Done s fixed. May uses the first 9 months of data and regression analysis to 5. The regression line May obtains is as follows: y = $2,545.8 +3.56X crosoft Excel to determine the RSquare and t Stat for the X Variable 1 st input fields and then continue to the next question. E TU manusctunng. May has been asked to estimate future monthly purchase costs for part #696 wo of Tudor's products. May has purchase cost and quantity data for the past 9 months as follows (Click the icon to view the data for the past 9 months) Estimated monthly purchases for this part based on expected demand of the two products for the rest of the year are as follows. (Click the icon to view the expected demand for the rest of the year) Read the requirements Requirement 1. The computer in May's office is down, and may has been asked to immediately provide an equation to estimate the future purchase cost for part #696. May grabs a calculator and uses the high-low method to estimate a cost equation What equation does she get? > Requirement 2. Using the equation from requirement 1, calculate the future expected purchase costs for each of the last 3 months of the year. High-Low Method Month Purchase Quantity Expected Expected Cost October 3,340 parts November 3.790 parts December 3,040 parts Requirement 3. After a few hours May's computer is foxed May uses the first 9 months of data and regression analysis to estimate the relationship between the quantity purchased and purchase costs of part #696. The regression line May obtains is as follows y=$2,545.8 +3.56X Stal P Question Help May Bly is the new manager of the materials storeroom for Tudor Manufacturing. May has been asked to estimate future monthly purchase costs for part 696, used in two of Tudor's products. May has purchase cost and quantity data for the past 9 months as follows: (Click the icon to view the data for the past 9 months) Estimated monthly purchases for this part based on expected demand of the two products for the rest of the year are as follows: Click the icon to view the expected demand for the rest of the year) Read the requirements Run a regression on the 9 months of data using Microsoft Excel to determine the R Square and 1 Stat for the X Vanable 1 statistics (Enter the RSquare and Stat amounts to six decimal places O XXXXXX) Regression Statistics R Square Stat X Variable 1 Evaluate the regression line using the critena of economic plausibility, goodness of fit and significance of the independent variable Economic plausibility Goodness of Significance of independent variable Compare the regression equation to the equation based on the high low method which is a better ft? Why? July UI IULUI pas HIS DIS ILMUW (Click the icon to view the data for the past 9 months) Estimated monthly purchases for this part based on expected demand of the two products for the rest of the year are as follows: B (Click the icon to view the expected demand for the rest of the year) Read the requirements Compare the regression equation to the equation based on the high-low method. Which is a better fit? Why? The is a better fit and more accurate estimate because it uses while the other method only relies on data points and may therefore miss some important information contained in the other data Requirement 4. Use the regression results to calculate the expected purchase costs for October November, and December. Compare the expected purchase costs to the expected purchase costs calculated using the high-low method in requirement 2. Comment on your results Begin by using the regression results to calculate the expected purchase costs for October, November, and December (Use amounts as given in the information to two decimal places. Do not found interim calculations, but then do round your final answers (expected cost amounts to the nearest whole dollar) Regression Equation Month Purchase Quantity Expected Expected Cost October 3,340 parts November 3.790 parts December 3,040 parts Compare the expected purchase costs to the expected purchase costs calculated using the high-low method in requiremont 2. Comment on your results Estimated monthly purchases for this part based on expected demand of the two products for the rest of the year are as follows: e Click the icon to view the expected demand for the rest of the year) Read the requirements Data pomes arju may rerecore miss some mportant mon comme une orier conta Requirement 4. Use the regression results to calculate the expected purchase costs for October, November, and December. Compare the expected purchase to the expected purchase costs calculated using the high-low method in requirement 2. Comment on your results, Begin by using the regression results to calculate the expected purchase costs for October, November, and December (Use amounts as given in the information two decimal places. Do not round interim calculations, but then do round your final answers (expected cost amounts) to the nearest whole dollar) Regression Equation Month Purchase Quantity Expected Expected Cost October 3.340 parts November 3.790 parts December 3.040 parts Compare the expected purchase costs to the expected purchase costs calculated using the high-low method in requirement 2 Comment on your results, Although the two equations are within the relevant range they give expected costs. This implies that the high and low points of the data are representation of the total set of points within the relevant range, Choose from any list or enter any number in the input Tields and then continue to the next question Question Help May Bly is the new manager of the materials storeroom for Tudor Manufacturing. May has been asked to estimate future monthly purchase costs for part 606, uped in two of Tudor's products. May has purchase cost and quantity data for the past months as follows: (Click the icon to view the data for the past months) Estimated monthly purchases for this part based on expected demand of the two products for the rest of the year are as follows: (Click the icon to view the expected demand for the rest of the year) Read the resulrements Requirement 1. The computer in May's office is down, and May has been asked to immediately provide an equation to estimate the future purchase cost for part 696. May grabs a calculator and uses the high-low method to estimate a cost equation What equation does she got? Requirement 2. Using the equation from requirement 1, calculate the future expected purchase costs for each of the last 3 months of the year. High-Low Method Month Purchase Quantity Expected Expected Cost October 3,340 parts November 3.790 parts December 3,040 parts Requirement 3. After a few hours May's computer is fixed. May uses the first 9 months of data and regression analysis to estimate the relationship between the quantity purchased and purchase costs of part #696 The regression line May obtains is as follows: y = $2,5458 -3,56% Run a regression on the 9 months of data using Microson Excel to determine the Square and 1 Stat for the X Variable 1 statistics (Enter the Square and I Stat amounts to six decimal places, o Xxxxxx) 2 Choose from any list or enter any number in the input fields and then continue to the next question Save for Later Run a regression on the 9 months of data using Microsoft Excel to determine the RSquare and 1 Stat for the X Variable 1 statistics (Enter the square and I St amounts to six decimal places, o xxxxxx) Regression Statistics R Square X Variable 1 he Evaluate the regression line using the criteria of economic plausibility, goodness of fit, and significance of the independent variable Economic plausibility Goodness of it Significance of independent variable Compare the regression equation to the equation based on the high-low method. Which is a better fit? Why? The while the other method only relies on is a better fit and more accurate estimate because it uses Choose from any list or enter any number in the input fields and then continue to the next question up Save for Later LLLLL Compare the regression equation to the equation based on the high-low method. Which is a better it? Why? The is a better fit and more accurate estimate because it uses while the other method only relies on data points and may therefore miss some important information contained in the other data Requirement 4. Use the regression results to calculate the expected purchase costs for October, November and December Compare the expected purchase costs to the expected purchase costs calculated using the high-low method in requirement 2 Comment on your results. Begin by using the regression results to calculate the expected purchase costs for October November, and December (Use amounts as given in the information to two decimal places. Do not round interim calculations, but then do round your final answers fexpected cost amounts) to the nearest whole dolfiar) Regression Equation Month Purchase Quantity Expected Expected Cost October 3,340 parts November 3,790 parts December 3,040 parts Compare the expected purchase costs to the expected purchase costs calculated using the high-low method in requirement Comment on your results. un pis poss Question Help May Bly is the new manager of the materials storeroom for Tudor Manufacturing May has been asked to estimate future monthly purchase costs for part #006, used in two of Tudor's products. May has purchase cost and quantity data for the past 9 months as follows (Click the icon to view the data for the past months) Estimated monthly purchases for this part based on expected demand of the two products for the rest of the year are as follows: (Click the icon to view the expected demand for the rest of the year) Read the requirements data points and may therefore miss some important information contained in the other data Requirement 4. Use the regression results to calculate the expected purchase costs for October, November, and December. Compare the expected purchase costs to the expected purchase costs calculated using the high-low method in requirement 2. Comment on your results. Begin by using the regression results to calculate the expected purchase costs for October November, and December (Use amounts as given in the information to two decimal places. Do not round interim calculations, but then do round your final answers (expected cost amounts) to the nearest whole dollar) Regression Equation Month Purchase Quantity Expected Expected Cost October 3,340 parts November 3,790 parts December 3,040 parts Compare the expected purchase costs to the expected purchase costs calculated using the high-low method in requirement 2. Comment on your results B Although the two equations are within the relevant range they give expected VE costs. This implies that the high and low points of the data are representation of the total set of points within the relevant range Question Help May Bly is the new manager of the materials storeroom for Tudor Manufacturing May has been asked to estimate future monthly purchase costs for part 096, used in to of Tudor's products. May has purchase cost and quantity data for the past 9 months as follows: (Click the icon to view the data for the past 9 months) Estimated monthly purchases for this part based on expected demand of the two products for the rest of the year are as follows: Click the icon to view the expected demand for the rest of the year) Read the regulements Requirement 1. The computer in May's office is down, and may has been asked to immediately provide an equation to estimate the future purchase cost for part weige May grabs a calculator and uses the high-low method to estimate a cost equation. What equation does she get? Purchase costs (9) ) Requirement 2. Using the equation from requirement 1, calculate the future expected purchase costs for each of the last 3 months of the year High-Low Method Month Purchase Quantity Expected Expected Cost October 3.340 parts November 3,790 parts December 3,040 parts Requirement 3. After a few hours May's computer is fixed. May uses the first 9 months of data and regression analysis to estimate the relationship between the quantity purchased and purchase costs of part #696. The regression line May obtains is as follows: y = 52 545.8 +3.56X Run a regression on the 9 months of data using Microsoft Excel to determine the RSquare and 1 Stat for the X Variable statistics (Enter the RSqaure and I Stat