Question: 1. Using the data input provided (Exhibit 1), prepare LAFs master budgets in Excel. Do not hard-code numbers into the spreadsheet, except in the financing
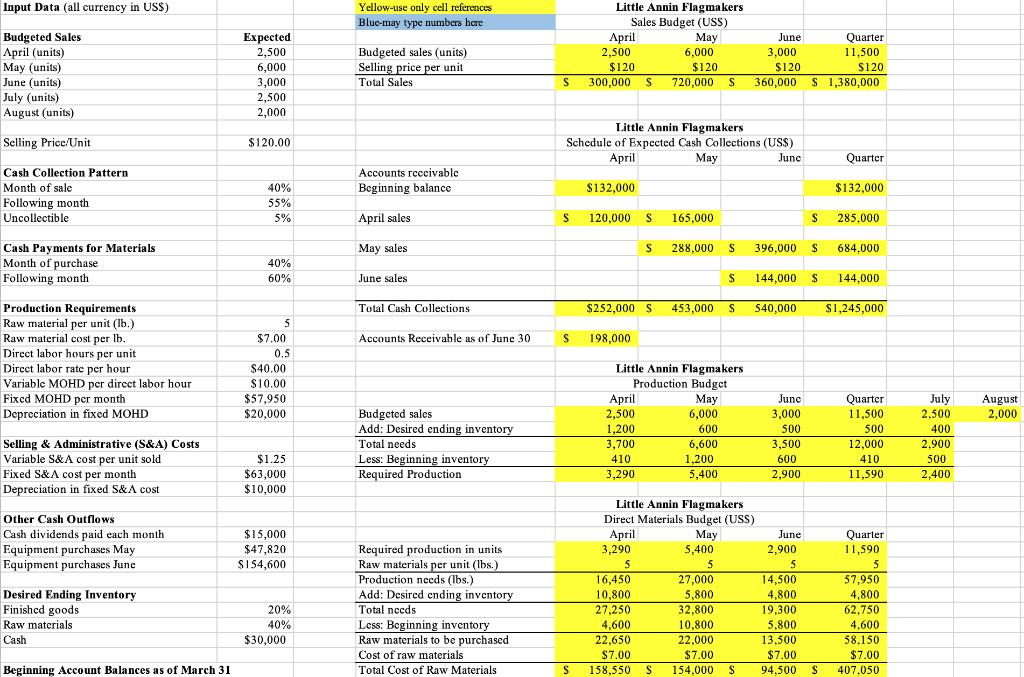
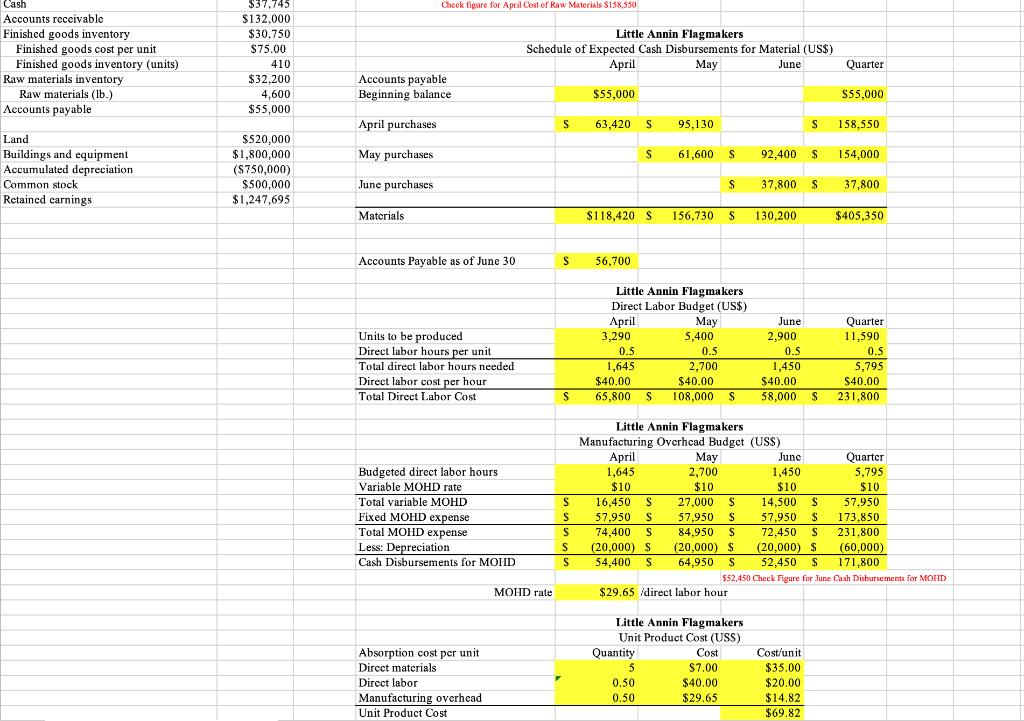
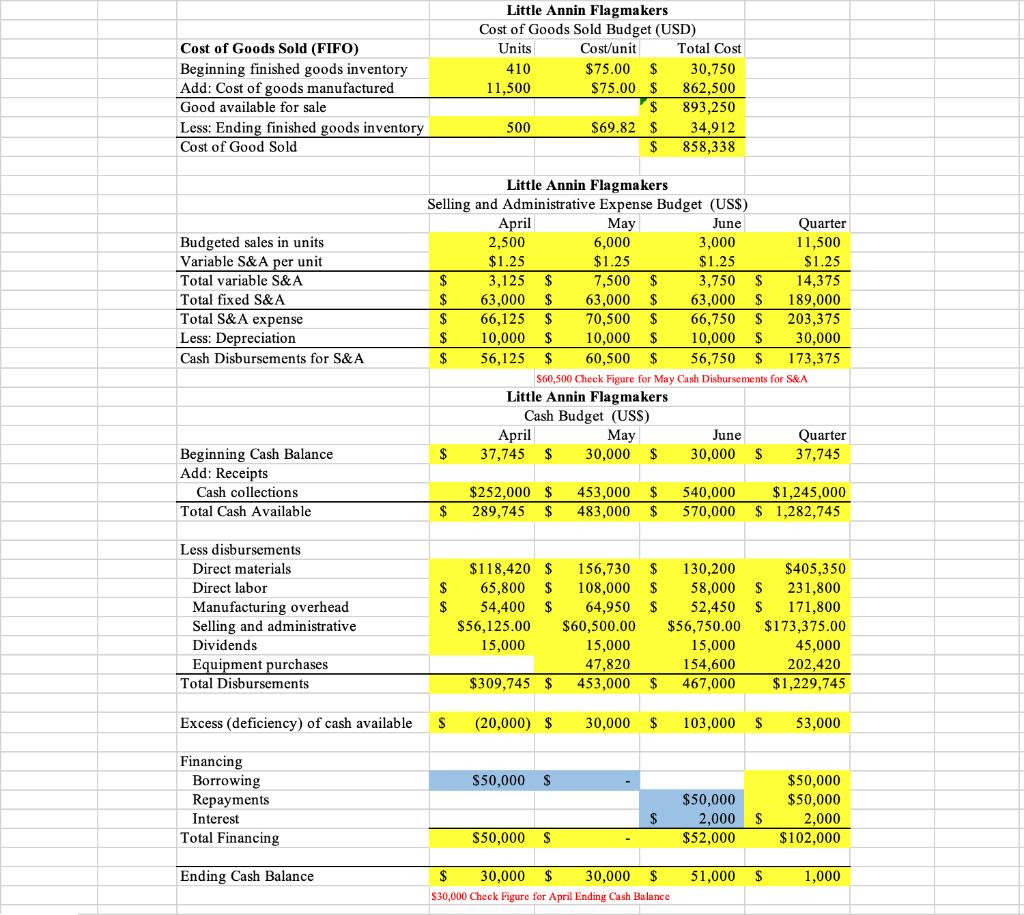
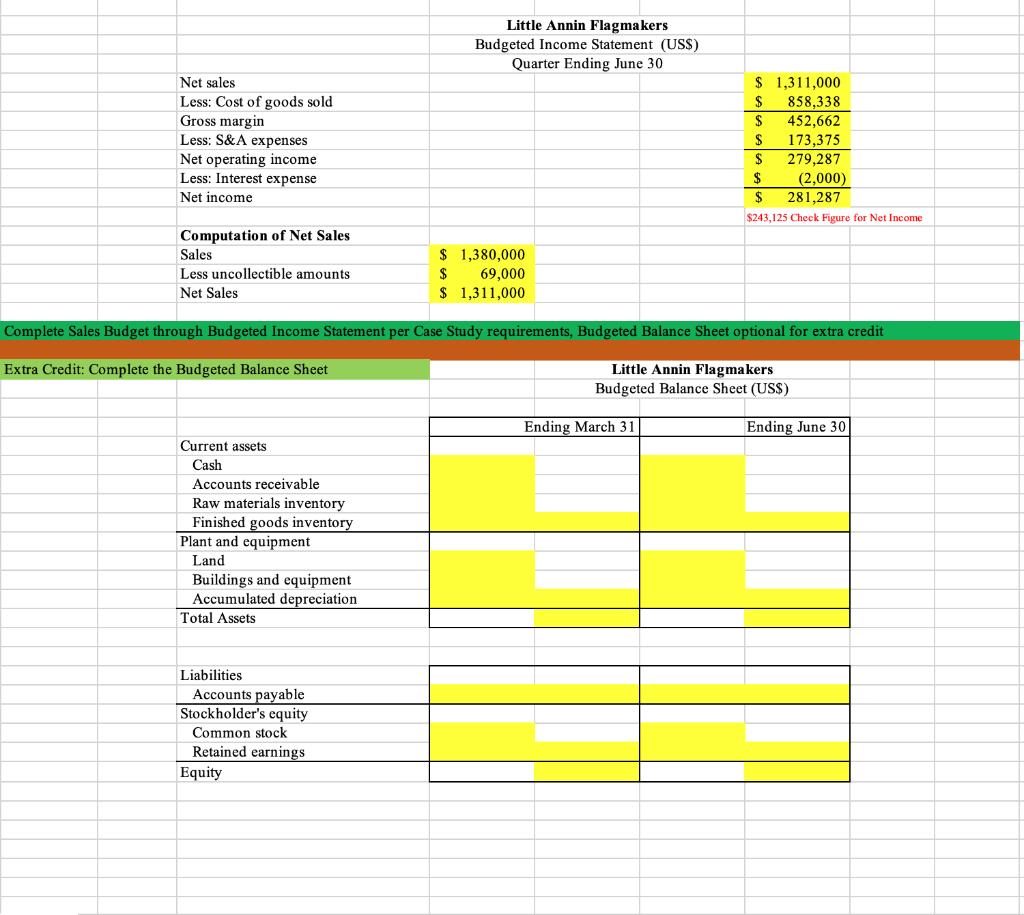
1. Using the data input provided (Exhibit 1), prepare LAF’s master budgets in Excel. Do not hard-code numbers into the spreadsheet, except in the financing section of the cash budget.
2. Conduct a sensitivity analysis, decreasing sales 2%, 5%, and 10% for April through August. New sales levels are provided in Exhibit 2. Adjust the financing and cash needs at these new sales levels.
3. Determine a credit recommendation for Kent Bank, to lend or not. Be prepared to justify your credit decision.
4. Explain why the cash budget is more important to a bank than the accounting net income when determining a credit decision.
5. Explain why decreases in sales is examined in a sensitivity analysis for a credit decision.


Little Annin Flagmakers Sales Budget (USS) Input Data (all currency in USS) Yellow-use only cell references Blue-may type numbers here Quarter 11,500 Budgeted Sales April (units) May (units) June (units) July (units) August (units) Expected 2,500 April 2,500 $120 300,000 S 720,000 S May 6,000 $120 June Budgeted sales (units) Selling price per unit 3,000 6,000 3,000 $120 $120 Total Sales 360,000 $ 1,380,000 2,500 2,000 Little Annin Flagmakers Schedule of Expected Cash Collections (USS) May Selling Price/Unit $120.00 pril June Quarter Cash Collection Pattern Accounts receivable Month of sale 40% Beginning balance $132,000 $132,000 Following month Uncollectible 55% 5% April sales 120,000 165,000 285,000 684,000 Cash Payments for Materials Month of purchase Following month May sales S 288,000 396,000 40% 60% June sales 144.000 144,000 $1,245,000 Production Requirements Raw material per unit (Ib.) Raw material cost per lb. Direct labor hours per unit Total Cash Collections $252,000 S 453,000 540,000 5 $7.00 Accounts Receivable as of June 30 198,000 0.5 Direct labor rate per hour Variable MOHD per dircct labor hour Fixed MOHD per month Depreciation in fixed MOHD Little Annin Flagmakers Production Budget April 2,500 1,200 $40.00 $10.00 Quarter 11,500 $57,950 May 6,000 June July 2,500 August 2,000 Budgeted sales Add: Desired ending inventory $20,000 3,000 600 500 500 400 Total needs Selling & Administrative (S&A) Costs Variable S&A cost per unit sold Fixed S&A cost per month Depreciation in fixed S&A cost 3,700 6,600 3,500 12,000 2,900 Less: Beginning inventory Required Production $1.25 410 1,200 5,400 600 410 500 $63,000 $10,000 3,290 2,900 11,590 2,400 Little Annin Flagmakers Direct Materials Budget (USS) pril 3,290 Other Cash Outflows Quarter Cash dividends paid each month Equipment purchases May Equipment purchases June $15,000 May 5,400 June Required production in units Raw materials per unit (Ibs.) Production needs (Ibs.) Add: Desired ending inventory Total needs Less: Beginning inventory Raw materials to be purchascd $47,820 2,900 5. 14,500 11,590 5 57,950 S154,600 5 16,450 27,000 5,800 Desired Ending Inventory Finished goods 10,800 27,250 4,800 62,750 4,600 58,150 $7.00 4,800 32,800 10,800 22,000 $7.00 154,000 19,300 5,800 13,500 20% 4,600 22,650 $7.00 158,550 Raw materials 40% Cash $30,000 Cost of raw materials $7.00 94,500 Beginning Account Balances as of March 31 Total Cost of Raw Materials S 407.050
Step by Step Solution
3.39 Rating (165 Votes )
There are 3 Steps involved in it

Get step-by-step solutions from verified subject matter experts


