Answered step by step
Verified Expert Solution
Question
1 Approved Answer
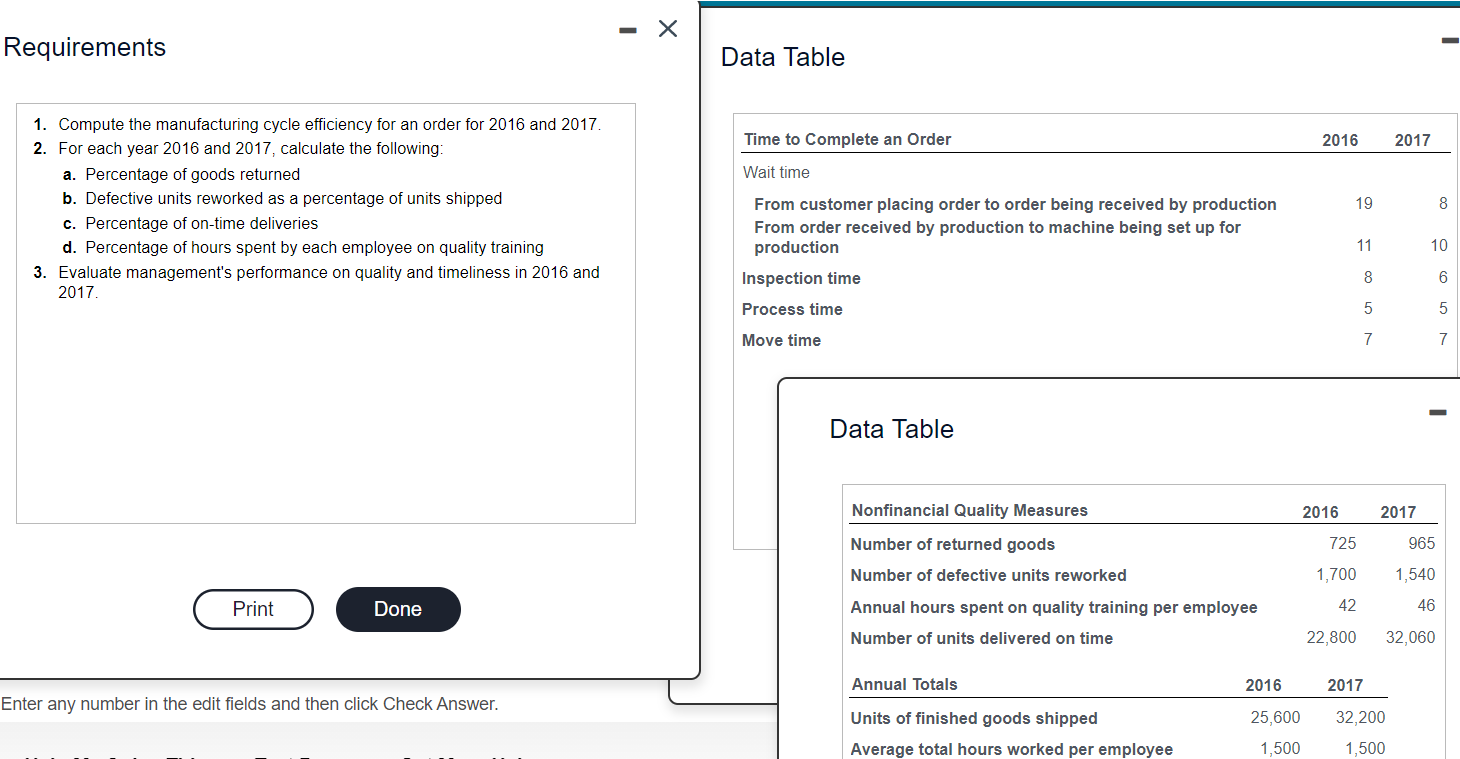
Requirements - Data Table 1. Compute the manufacturing cycle efficiency for an order for 2016 and 2017. 2. For each year 2016 and 2017,

Requirements - Data Table 1. Compute the manufacturing cycle efficiency for an order for 2016 and 2017. 2. For each year 2016 and 2017, calculate the following: a. Percentage of goods returned b. Defective units reworked as a percentage of units shipped c. Percentage of on-time deliveries d. Percentage of hours spent by each employee on quality training 3. Evaluate management's performance on quality and timeliness in 2016 and 2017. Process time Move time Time to Complete an Order Wait time 2016 2017 From customer placing order to order being received by production From order received by production to machine being set up for production 19 8 11 10 Inspection time 8 6 5 7 7 Data Table Nonfinancial Quality Measures Number of returned goods Number of defective units reworked 2016 2017 725 965 1,700 1,540 Print Done Annual hours spent on quality training per employee 42 46 Number of units delivered on time 22,800 32,060 Annual Totals 2016 2017 Enter any number in the edit fields and then click Check Answer. Units of finished goods shipped 25,600 32,200 Average total hours worked per employee 1,500 1,500 -
Step by Step Solution
There are 3 Steps involved in it
Step: 1
Heres the data with the required information Year20162017 Manufacturing Cycle Efficiency075085 Percentage of Goods Returned32 Defective Units Reworked ...
Get Instant Access to Expert-Tailored Solutions
See step-by-step solutions with expert insights and AI powered tools for academic success
Step: 2

Step: 3

Ace Your Homework with AI
Get the answers you need in no time with our AI-driven, step-by-step assistance
Get Started


