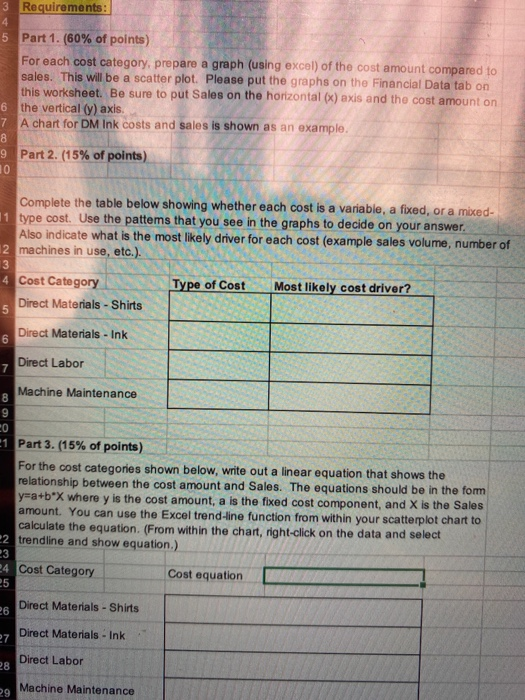
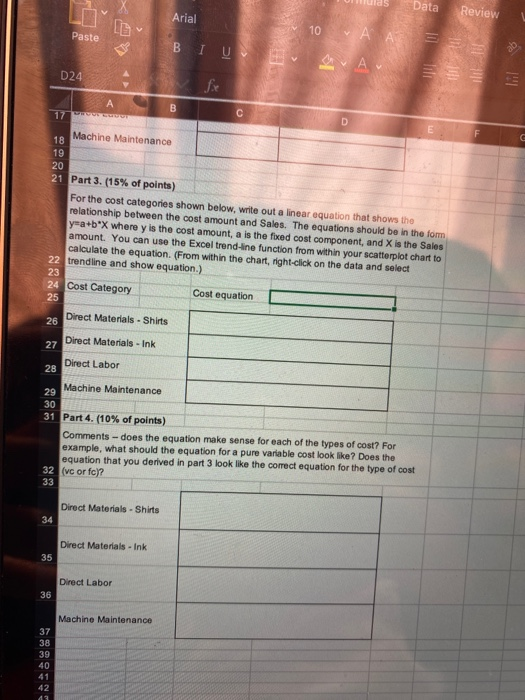
Requirements: Part 1. (60% of points) For each cost category, prepare a graph (using excel) of the cost amount compared to sales. This will be a scatter plot. Please put the graphs on the Financial Data tab on this worksheet. Be sure to put Sales on the horizontal (x) axis and the cost amount on the vertical (y) axis. A chart for DM Ink costs and sales is shown as an example Part 2. (15% of points) Complete the table below showing whether each cost is a variable, a fixed, or a mixed- 1 type cost. Use the pattems that you see in the graphs to decide on your answer. Also indicate what is the most likely driver for each cost (example sales volume, number of 2 machines in use, etc.) 4 Cost Category Type of Cost Most likely cost driver? 5 Direct Materials - Shirts 6 Direct Materials - Ink Direct Labor Machine Maintenance 1 Part 3. (15% of points) For the cost categories shown below, write out a linear equation that shows the relationship between the cost amount and Sales. The equations should b yma+bx where y is the cost amount, a is the fixed cost component, and X is the Sales amount. You can use the Excel trend-line function from within your scatterplot chart to calculate the equation. (From within the chart, right-click on the data and select 2 trendline and show equation.) 4 Cost Category Cost equation Direct Materials - Shirts Direct Materials - Ink Direct Labor Machine Maintenance ulas Data Review Loa Arial Paste 10A A === D24 fp lil 18 Machine Maintenance E F G 20 21 Part 3. (15% of points) For the cost categories shown below, write out a linear equation that shows the relationship between the cost amount and Sales. The equations should be in the form ywa+bx where y is the cost amount, a is the fixed cost component, and X is the Sales amount. You can use the Excel trend-ine function from within your scatterplot chart to calculate the equation. (From within the chart, right click on the data and select 22 trendline and show equation.) 23 24 Cost Category Cost equation Direct Materials - Shirts 27 Direct Materials - Ink Direct Labor 29 Machine Maintenance 30 31 Part 4. (10% of points) Comments - does the equation make sense for each of the types of cost? For example, what should the equation for a pure variable cost look like? Does the equation that you derived in part 3 look like the correct equation for the type of cost 32 (vc or fc)? Direct Materials - Shirts Direct Materials - Ink Direct Labor Machine Maintenance Requirements: Part 1. (60% of points) For each cost category, prepare a graph (using excel) of the cost amount compared to sales. This will be a scatter plot. Please put the graphs on the Financial Data tab on this worksheet. Be sure to put Sales on the horizontal (x) axis and the cost amount on the vertical (y) axis. A chart for DM Ink costs and sales is shown as an example Part 2. (15% of points) Complete the table below showing whether each cost is a variable, a fixed, or a mixed- 1 type cost. Use the pattems that you see in the graphs to decide on your answer. Also indicate what is the most likely driver for each cost (example sales volume, number of 2 machines in use, etc.) 4 Cost Category Type of Cost Most likely cost driver? 5 Direct Materials - Shirts 6 Direct Materials - Ink Direct Labor Machine Maintenance 1 Part 3. (15% of points) For the cost categories shown below, write out a linear equation that shows the relationship between the cost amount and Sales. The equations should b yma+bx where y is the cost amount, a is the fixed cost component, and X is the Sales amount. You can use the Excel trend-line function from within your scatterplot chart to calculate the equation. (From within the chart, right-click on the data and select 2 trendline and show equation.) 4 Cost Category Cost equation Direct Materials - Shirts Direct Materials - Ink Direct Labor Machine Maintenance ulas Data Review Loa Arial Paste 10A A === D24 fp lil 18 Machine Maintenance E F G 20 21 Part 3. (15% of points) For the cost categories shown below, write out a linear equation that shows the relationship between the cost amount and Sales. The equations should be in the form ywa+bx where y is the cost amount, a is the fixed cost component, and X is the Sales amount. You can use the Excel trend-ine function from within your scatterplot chart to calculate the equation. (From within the chart, right click on the data and select 22 trendline and show equation.) 23 24 Cost Category Cost equation Direct Materials - Shirts 27 Direct Materials - Ink Direct Labor 29 Machine Maintenance 30 31 Part 4. (10% of points) Comments - does the equation make sense for each of the types of cost? For example, what should the equation for a pure variable cost look like? Does the equation that you derived in part 3 look like the correct equation for the type of cost 32 (vc or fc)? Direct Materials - Shirts Direct Materials - Ink Direct Labor Machine Maintenance


