

Answered step by step
Verified Expert Solution
Question
1 Approved Answer
Research any local (South African) company using the library and internet resources. Download its annual reports for 2018 and 2020 and answer the questions below.
Research any local (South African) company using the library and internet resources. Download its annual reports for 2018 and 2020 and answer the questions below.
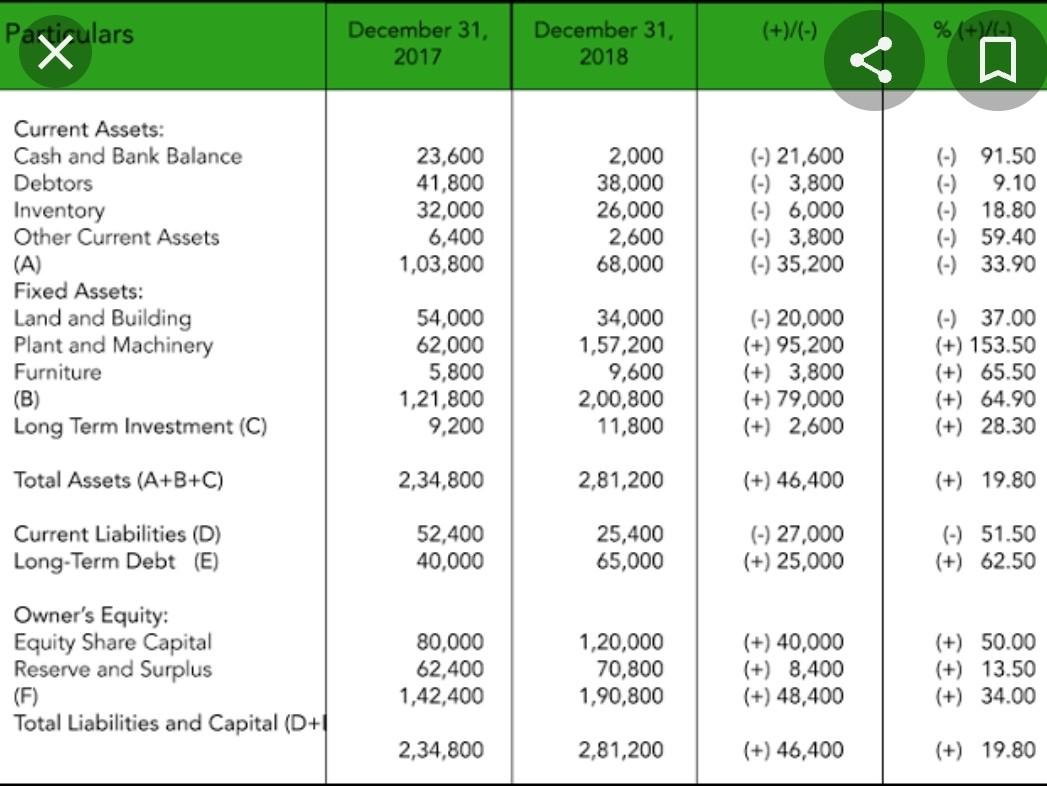
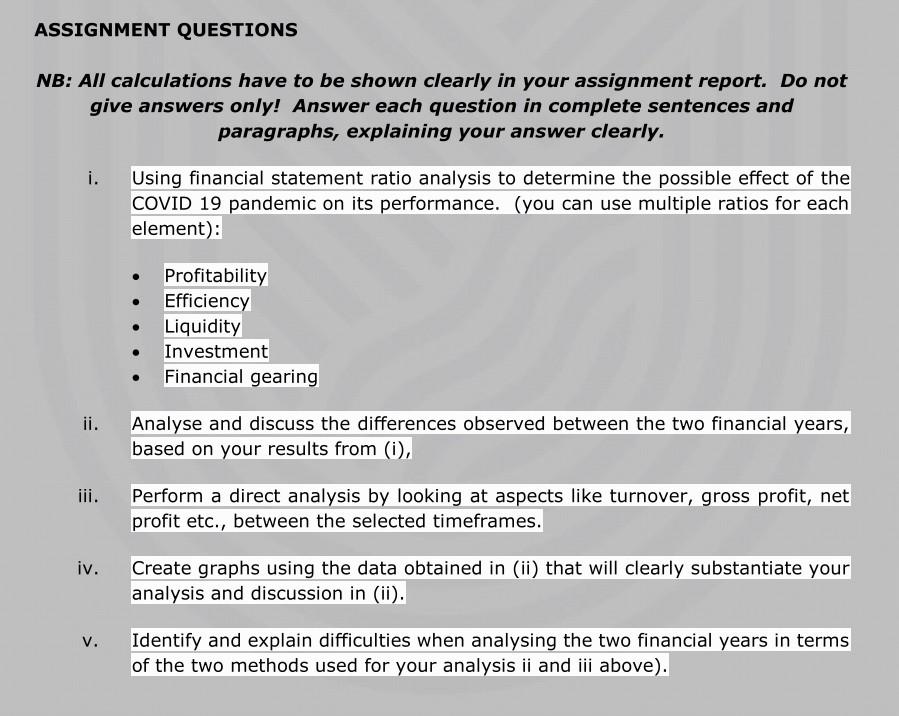
ASSIGNMENT QUESTIONS NB: All calculations have to be shown clearly in your assignment report. Do not give answers only! Answer each question in complete sentences and paragraphs, explaining your answer clearly. i. Using financial statement ratio analysis to determine the possible effect of the COVID 19 pandemic on its performance. (you can use multiple ratios for each element): Profitability Efficiency Liquidity Investment Financial gearing ii. Analyse and discuss the differences observed between the two financial years, based on your results from (i), iii. Perform a direct analysis by looking at aspects like turnover, gross profit, net profit etc., between the selected timeframes. iv. Create graphs using the data obtained in (ii) that will clearly substantiate your analysis and discussion in (ii). V. Identify and explain difficulties when analysing the two financial years in terms of the two methods used for your analysis ii and iii above). Particulars X Current Assets: Cash and Bank Balance Debtors Inventory Other Current Assets (A) Fixed Assets: Land and Building Plant and Machinery Furniture (B) Long Term Investment (C) Total Assets (A+B+C) Current Liabilities (D) Long-Term Debt (E) Owner's Equity: Equity Share Capital Reserve and Surplus (F) Total Liabilities and Capital (D+1 December 31, 2017 23,600 41,800 32,000 6,400 1,03,800 54,000 62,000 5,800 1,21,800 9,200 2,34,800 52,400 40,000 80,000 62,400 1,42,400 2,34,800 December 31, 2018 2,000 38,000 26,000 2,600 68,000 34,000 1,57,200 9,600 2,00,800 11,800 2,81,200 25,400 65,000 1,20,000 70,800 1,90,800 2,81,200 (+)/(-) (-) 21,600 (-) 3,800 (-) 6,000 (-) 3,800 (-) 35,200 (-) 20,000 (+) 95,200 (+) 3,800 (+) 79,000 (+) 2,600 (+) 46,400 (-) 27,000 (+) 25,000 (+) 40,000 (+) 8,400 (+) 48,400 (+) 46,400 % (+)/(-) (-) 91.50 (-) 9.10 (-) 18.80 (-) 59.40 (-) 33.90 (-) 37.00 (+) 153.50 (+) 65.50 (+) 64.90 (+) 28.30 (+) 19.80 (-) 51.50 (+) 62.50 (+) 50.00 (+) 13.50 (+) 34.00 (+) 19.80 ASSIGNMENT QUESTIONS NB: All calculations have to be shown clearly in your assignment report. Do not give answers only! Answer each question in complete sentences and paragraphs, explaining your answer clearly. i. Using financial statement ratio analysis to determine the possible effect of the COVID 19 pandemic on its performance. (you can use multiple ratios for each element): Profitability Efficiency Liquidity Investment Financial gearing ii. Analyse and discuss the differences observed between the two financial years, based on your results from (i), iii. Perform a direct analysis by looking at aspects like turnover, gross profit, net profit etc., between the selected timeframes. iv. Create graphs using the data obtained in (ii) that will clearly substantiate your analysis and discussion in (ii). V. Identify and explain difficulties when analysing the two financial years in terms of the two methods used for your analysis ii and iii above). Particulars X Current Assets: Cash and Bank Balance Debtors Inventory Other Current Assets (A) Fixed Assets: Land and Building Plant and Machinery Furniture (B) Long Term Investment (C) Total Assets (A+B+C) Current Liabilities (D) Long-Term Debt (E) Owner's Equity: Equity Share Capital Reserve and Surplus (F) Total Liabilities and Capital (D+1 December 31, 2017 23,600 41,800 32,000 6,400 1,03,800 54,000 62,000 5,800 1,21,800 9,200 2,34,800 52,400 40,000 80,000 62,400 1,42,400 2,34,800 December 31, 2018 2,000 38,000 26,000 2,600 68,000 34,000 1,57,200 9,600 2,00,800 11,800 2,81,200 25,400 65,000 1,20,000 70,800 1,90,800 2,81,200 (+)/(-) (-) 21,600 (-) 3,800 (-) 6,000 (-) 3,800 (-) 35,200 (-) 20,000 (+) 95,200 (+) 3,800 (+) 79,000 (+) 2,600 (+) 46,400 (-) 27,000 (+) 25,000 (+) 40,000 (+) 8,400 (+) 48,400 (+) 46,400 % (+)/(-) (-) 91.50 (-) 9.10 (-) 18.80 (-) 59.40 (-) 33.90 (-) 37.00 (+) 153.50 (+) 65.50 (+) 64.90 (+) 28.30 (+) 19.80 (-) 51.50 (+) 62.50 (+) 50.00 (+) 13.50 (+) 34.00 (+) 19.80
Step by Step Solution
There are 3 Steps involved in it
Step: 1

Get Instant Access to Expert-Tailored Solutions
See step-by-step solutions with expert insights and AI powered tools for academic success
Step: 2

Step: 3
Ace Your Homework with AI
Get the answers you need in no time with our AI-driven, step-by-step assistance
Get Started
The Palgrave International Handbook Of Basic Income
Authors: Malcolm Torry
1st Edition
3030236137, 978-3030236137