

Question
Resistors for electronic circuits are manufactured on a high-speed automated machine. The machine is set up to produce a large run of resistors of 1,000
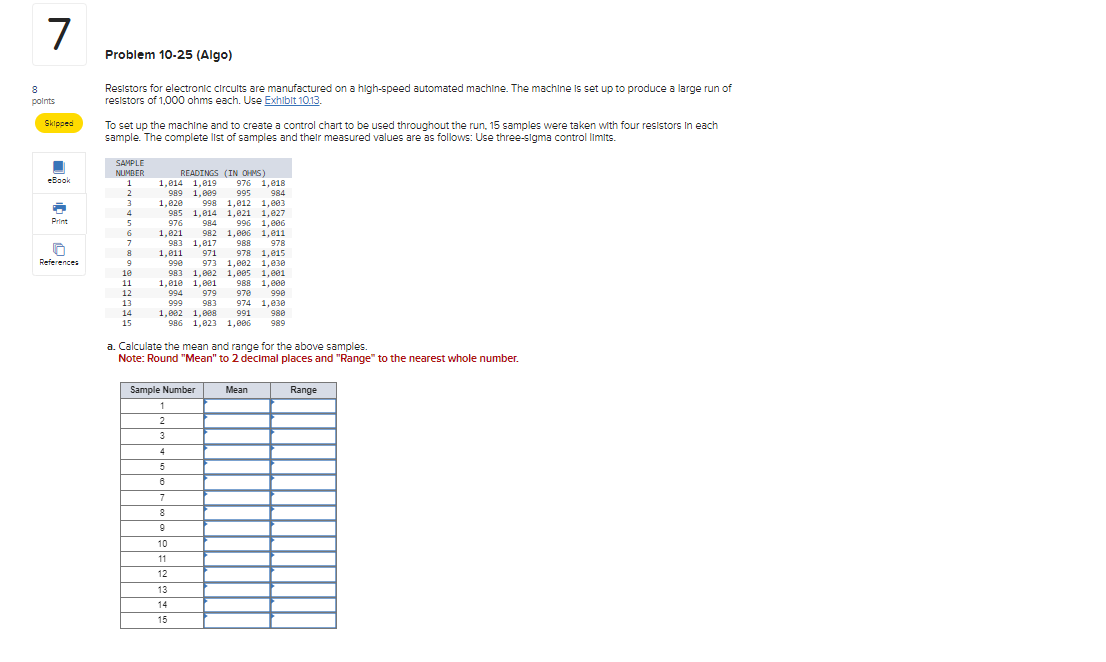
Resistors for electronic circuits are manufactured on a high-speed automated machine. The machine is set up to produce a large run of resistors of 1,000 ohms each. Use Exhibit 10.13.
To set up the machine and to create a control chart to be used throughout the run, 15 samples were taken with four resistors in each sample. The complete list of samples and their measured values are as follows: Use three-sigma control limits.
| SAMPLE NUMBER | READINGS (IN OHMS) | |||
|---|---|---|---|---|
| 1 | 1,014 | 1,019 | 976 | 1,018 |
| 2 | 989 | 1,009 | 995 | 984 |
| 3 | 1,020 | 998 | 1,012 | 1,003 |
| 4 | 985 | 1,014 | 1,021 | 1,027 |
| 5 | 976 | 984 | 996 | 1,006 |
| 6 | 1,021 | 982 | 1,006 | 1,011 |
| 7 | 983 | 1,017 | 988 | 978 |
| 8 | 1,011 | 971 | 978 | 1,015 |
| 9 | 990 | 973 | 1,002 | 1,030 |
| 10 | 983 | 1,002 | 1,005 | 1,001 |
| 11 | 1,010 | 1,001 | 988 | 1,000 |
| 12 | 994 | 979 | 970 | 990 |
| 13 | 999 | 983 | 974 | 1,030 |
| 14 | 1,002 | 1,008 | 991 | 980 |
| 15 | 986 | 1,023 | 1,006 | 989 |
Calculate the mean and range for the above samples.
Note: Round "Mean" to 2 decimal places and "Range" to the nearest whole number.
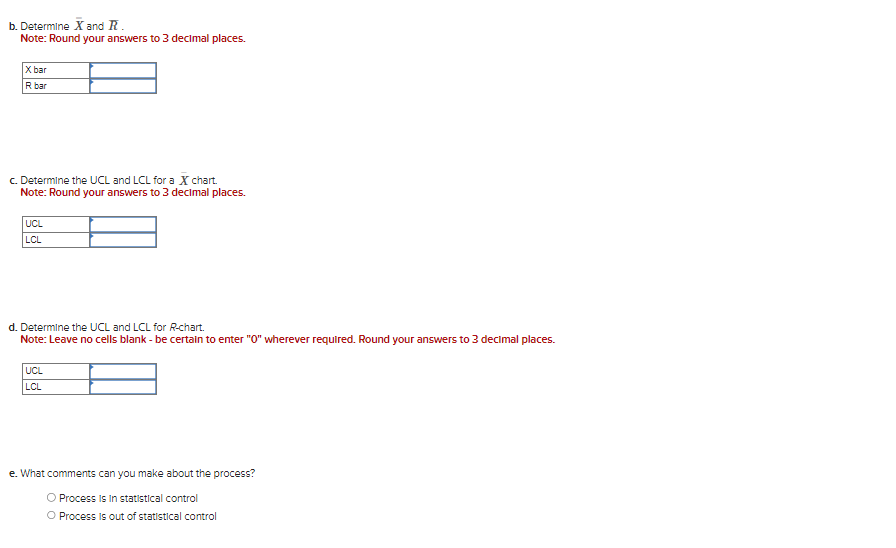
Determine Double Bar X and R Bar .
Note: Round your answers to 3 decimal places.
Determine the UCL and LCL for a X Bar chart.
Note: Round your answers to 3 decimal places.
Determine the UCL and LCL for R-chart.
Note: Leave no cells blank - be certain to enter "0" wherever required. Round your answers to 3 decimal places.
What comments can you make about the process?
A. Process is in statistical control
B. Process is out of statistical control
Resistors for electronic clrcults are manufactured on a high-speed automated machine. The machine is set up to produce a large run of resistors of 1,000 ohms each. Use To set up the machine and to create a control chart to be used throughout the run, 15 samples were taken with four resistors in each sample. The complete list of samples and thelr measured values are as follows: Use three-sigma control limits. a. Calculate the mean and range for the above samples. Note: Round "Mean" to 2 decimal places and "Range" to the nearest whole number. b. Determine X and R. Note: Round your answers to 3 declmal places. c. Determine the UCL and LCL for a X chart. Note: Round your answers to 3 declmal places. d. Determine the UCL and LCL for R-chart. Note: Leave no cells blank - be certain to enter " 0 " wherever required. Round your answers to 3 decimal places. e. What comments can you make about the process? Process is in statistical control Process is out of statistical controlStep by Step Solution
There are 3 Steps involved in it
Step: 1

Get Instant Access to Expert-Tailored Solutions
See step-by-step solutions with expert insights and AI powered tools for academic success
Step: 2

Step: 3
Ace Your Homework with AI
Get the answers you need in no time with our AI-driven, step-by-step assistance
Get Started
Quantitative Analysis For Management
Authors: Barry Render, Ralph M. Stair, Michael E. Hanna
11th Edition
9780132997621, 132149117, 132997622, 978-0132149112