Restaurant Grades Case Analysis
see link below for all needed details
https://1drv.ms/w/s!AlPHtSKe27aeZ_9NmhIcoD67GAc?e=BaxszW
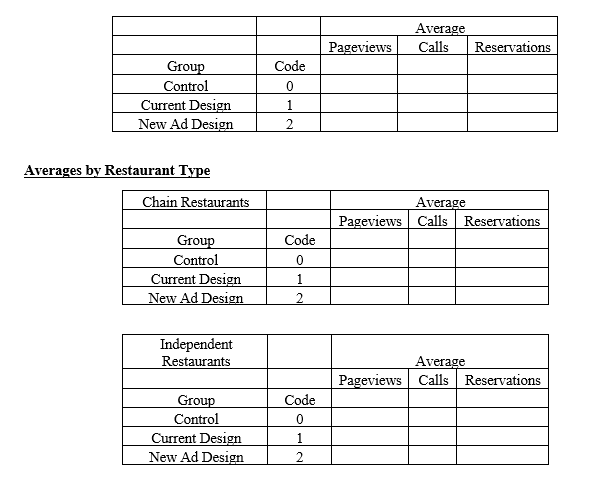
1) In Excel, calculate averages for pageviews, calls, and reservations by the treatment group column - you will have three average values, one for each group. Tabulate them. Make comparisons and then inferences.
2) Split the sample based on column F -restaurant type.Now you can analyze based on whether the restaurant is chain/independent. Now recalculate the averages as in step 1 again. See if your inferences hold based on restaurant type.
Use the following questions as guidance as you provide recommendation.
1) In your analysis, how successful is RG's current advertising package? There is a proposal for an alternate design on the table.With the data you have access to, do you recommend staying the course or making the switch?
2) If you had the opportunity to collect more data, which would be the most important elements you would want to add to inform your decision?
3) Given that there were already businesses that were advertising on the platform, did they even need to run this experiment, or could they just have compared outcomes for businesses who advertise and those who do not?
Average Pageviews Calls Reservations Group Code Control 0 Current Design New Ad Design 2 Averages by Restaurant Type Chain Restaurants Average Pageviews Calls Reservations Group Code Control 0 Current Design New Ad Design 2 Independent Restaurants Average Pageviews Calls Reservations Group Code Control 0 Current Design New Ad Design 2Advertising Experiments at RestaurantGrades Shirley A. Critic, founder of RestaurantGrades {RIG}, a restaurant review platform (similar to Yelp or TIipAdvisor) with an impressive stock of online reviews written by ordinary restaurantgoers, was happy with RG's growth and position in the industry, and had compelling evidence that RG reviews had an important inuence on the restaurant choices people made. However, doubts had surfaced about the efficacy of the company's main source of revenue selling advertisements (ads) to restaurants. To better understand this issue, Critic decided to run a largescale randomized controlled trial with a control group and two treatment groups: one to test the impact of RG's current ads on restaurant sales, and the other to test the impact of an alternative ad design to which she was considering switching. Her team ran the experiment and found the results in the spreadsheet attached in the data supplement. Being a data nerd (in the best possible sense} and knowing that the devil was often in the details, Critic wanted to look at the results herself. She wanted to understand whether her company's ads really worked, and whether they should stick with the current design or switch to the alternative design. Background on RG Advertisements On RG, each restaurant had a profile page with operating information including its hours, phone number, and location, where RG users who visited the restaurant could leave reviews for other users. Users could also discover and search for restaurants on the platform using lters, and could make reservations and order food through a restaurant' 5 profile page. The majority of RG's revenues stemmed from selling ads through its sales team, which coldcalled restaurants to try to convince them to advertise on the platform. Advertisements, labeled as sponsored search results, were placed in a separate section above the organic results for searches conducted by users. Packages of ads were purchased for about $300 per month, and advertisers were required to sign up for a oneyear contract. 1Wl'lile RIG used a search algorithm much like Google's that determined when and which ads were shown, depending on a user' s search for restaurants on the platform, restaurants had little say in what search terms would trigger their ads. However, RG guaranteed that their ads would be shown a minimum of 1,000 times per month to users. RG's current search algorithm showed ads for restaurants triggered by type of cuisine within a 0.5- mile radius of a user' s search. For example, if a user searched for Italian restaurants in Harvard Square, the algorithm chose two Italian restaurants within Harvard Square to advertise. The engineering team had run a variety of tests looking at how users responded to different types of ads in different searches, and had designed an alternative search algorithm. Rather than choosing two restaurants by cuisine, the alternative algorithm showed ads when a user searched for a specific restaurant and rinse to display two restaurants with similar ratings and hours. While Critic's team was reasonably satised with how the current algorithm showed ads, they were open to the possibility that the alternative design might be significantly better {or signicantly worse] in providing benefit for their advertisers. Experiment For the experiment, Critic's team randomly selected 30,000 restaurants that were active on its platformbut were not currently advertising, yielding a sample that was representative of its population of restaurants in the US. For the onemonth duration of the experiment, 10,000 of these restaurants were randomly chosen to receive free ads using the current advertising approach, and another 10,000 restaurants were randomly selected to receive the alternatively designed ads. The main difference between these two treatment groups was that the alternative design used a very different algorithm to decide when to deliver ads and which ads to pair with each search, as described above. The remaining 10,000 restaurants received no advertisements. None of these restaurants were informed about the experiment or the advertisements. Spreadsheet The spreadsheet supplement for this exercise (H'BS No. 916?02} contains the outcomes that Critic' s team observed for the 30,000 restaurants during the onemonth experiment. The unit of observation is a restaurantmonth, so the data for each restaurant are in a single row. For example, in a row, \"pageviews" refers to the number of unique visits to a restaurant' s RG page during that month. The outcome variables included are as follows: Variables m The restaurant's unique identier = 0: in the control group = 1: in the rst treatment group [ads using current algorithm] = 2: in the second treatment group [ads using alternative algorithm} restaurant type = chain: chain restaurants = independent: independent restaurants # of visits to the restaurant' s RG page per month # of phone calls made from the restaurant' s mobile RG page per month # of reservations made from the restaurant' s RG page per month