

Answered step by step
Verified Expert Solution
Question
1 Approved Answer
resulting false-positive rates of 20% to 68%. A cohort study to evaluate the relationship of serum retinol (vitamin A) levels to prostate cancer was
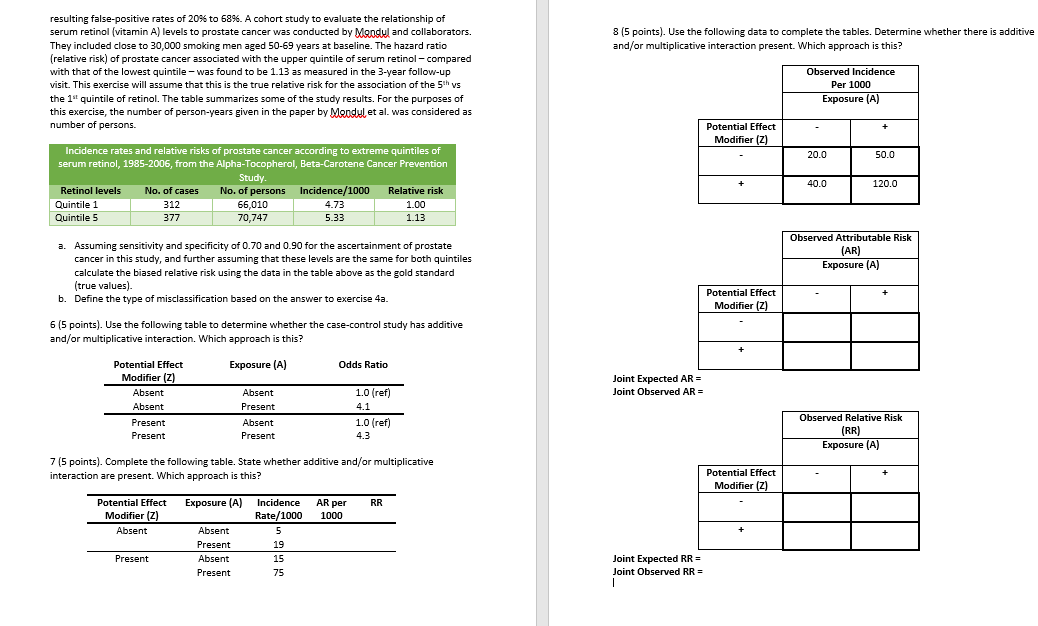
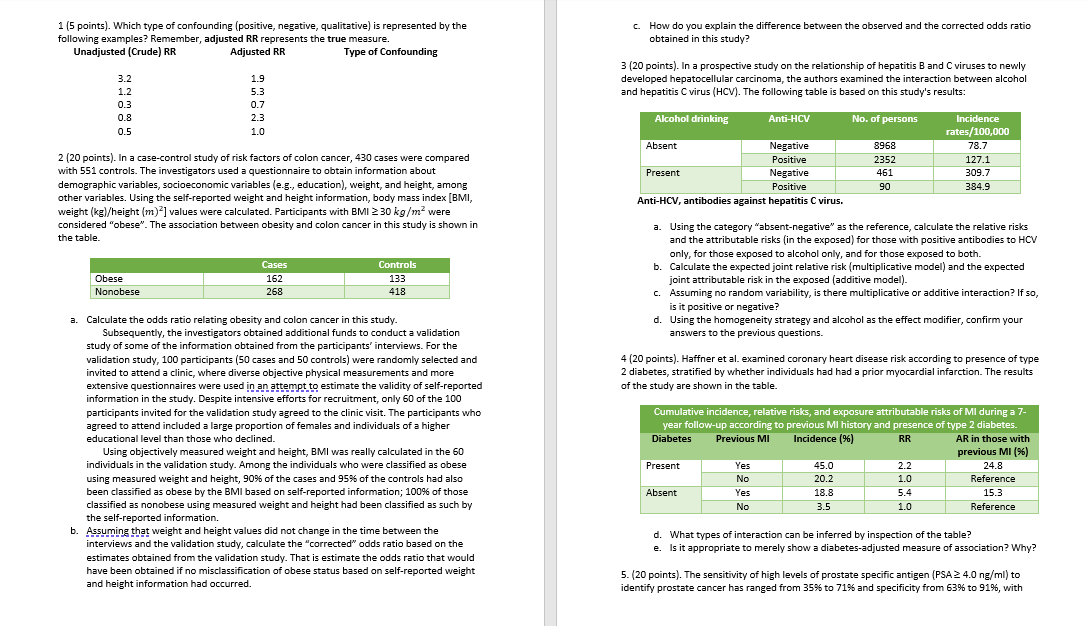
resulting false-positive rates of 20% to 68%. A cohort study to evaluate the relationship of serum retinol (vitamin A) levels to prostate cancer was conducted by Mandul and collaborators. They included close to 30,000 smoking men aged 50-69 years at baseline. The hazard ratio (relative risk) of prostate cancer associated with the upper quintile of serum retinol-compared with that of the lowest quintile - was found to be 1.13 as measured in the 3-year follow-up visit. This exercise will assume that this is the true relative risk for the association of the 5th vs the 1st quintile of retinol. The table summarizes some of the study results. For the purposes of this exercise, the number of person-years given in the paper by Mondul et al. was considered as number of persons. Incidence rates and relative risks of prostate cancer according to extreme quintiles of serum retinol, 1985-2006, from the Alpha-Tocopherol, Beta-Carotene Cancer Prevention Study. Retinol levels No. of cases Quintile 1 312 377 Quintile 5 a. Assuming sensitivity and specificity of 0.70 and 0.90 for the ascertainment of prostate cancer in this study, and further assuming that these levels are the same for both quintiles calculate the biased relative risk using the data in the table above as the gold standard (true values). b. Define the type of misclassification based on the answer to exercise 4a. Potential Effect Modifier (Z) 6 (5 points). Use the following table to determine whether the case-control study has additive and/or multiplicative interaction. Which approach is this? Exposure (A) Absent Absent No. of persons 66,010 70,747 Present Present Present Absent Present Incidence/1000 Relative risk 4.73 1.00 5.33 1.13 Absent Present Potential Effect Exposure (A) Modifier (Z) Absent Absent Present Absent Present Odds Ratio 7 (5 points). Complete the following table. State whether additive and/or multiplicative interaction are present. Which approach is this? 1.0 (ref) 4.1 1.0 (ref) 4.3 Incidence AR per RR 1000 Rate/1000 5 19 15 75 8 (5 points). Use the following data to complete the tables. Determine whether there is additive and/or multiplicative interaction present. Which approach is this? Joint Expected AR= Joint Observed AR = Joint Expected RR = Joint Observed RR = I Potential Effect Modifier (Z) + Potential Effect Modifier (Z) + Potential Effect Modifier (Z) + Observed Incidence Per 1000 Exposure (A) - 20.0 40.0 + 50.0 120.0 Observed Attributable Risk (AR) Exposure (A) + Observed Relative Risk (RR) Exposure (A) + 1 (5 points). Which type of confounding (positive, negative, qualitative) is represented by the following examples? Remember, adjusted RR represents the true measure. Unadjusted (Crude) RR Adjusted RR Type of Confounding 3.2 1.2 0.3 0.8 0.5 1.9 5.3 0.7 2.3 1.0 2 (20 points). In a case-control study of risk factors of colon cancer, 430 cases were compared with 551 controls. The investigators used a questionnaire to obtain information about demographic variables, socioeconomic variables (e.g., education), weight, and height, among other variables. Using the self-reported weight and height information, body mass index [BMI, weight (kg)/height (m)2] values were calculated. Participants with BMI 30 kg/m were considered "obese". The association between obesity and colon cancer in this study is shown in the table Obese Nonobese Cases 162 268 Controls 133 418 a. Calculate the odds ratio relating obesity and colon cancer in this study. Subsequently, the investigators obtained additional funds to conduct a validation study of some of the information obtained from the participants' interviews. For the validation study, 100 participants (50 cases and 50 controls) were randomly selected and invited to attend a clinic, where diverse objective physical measurements and more extensive questionnaires were used in an attempt to estimate the validity of self-reported information in the study. Despite intensive efforts for recruitment, only 60 of the 100 participants invited for the validation study agreed to the clinic visit. The participants who agreed to attend included a large proportion of females and individuals of a higher educational level than those who declined. Using objectively measured weight and height, BMI was really calculated in the 60 individuals in the validation study. Among the individuals who were classified as obese using measured weight and height, 90% of the cases and 95% of the controls had also been classified as obese by the BMI based on self-reported information; 100% of those classified as nonobese using measured weight and height had been classified as such by the self-reported information. b. Assuming that weight and height values did not change in the time between the interviews and the validation study, calculate the "corrected" odds ratio based on the estimates obtained from the validation study. That is estimate the odds ratio that would have been obtained if no misclassification of obese status based on self-reported weight and height information had occurred. c. How do you explain the difference between the observed and the corrected odds ratio obtained in this study? 3 (20 points). In a prospective study on the relationship of hepatitis B and C viruses to newly developed hepatocellular carcinoma, the authors examined the interaction between alcohol and hepatitis C virus (HCV). The following table is based on this study's results: Alcohol drinking Absent Negative Positive Negative Positive Anti-HCV, antibodies against hepatitis C virus. Present Anti-HCV Present a. Using the category "absent-negative" as the reference, calculate the relative risks and the attributable risks (in the exposed) for those with positive antibodies to HCV only, for those exposed to alcohol only, and for those exposed to both. b. Calculate the expected joint relative risk (multiplicative model) and the expected joint attributable risk in the exposed (additive model). c. Assuming no random variability, is there multiplicative or additive interaction? If so, is it positive or negative? d. Using the homogeneity strategy and alcohol as the effect modifier, confirm your answers to the previous questions. Absent No. of persons 4 (20 points). Haffner et al. examined coronary heart disease risk according to presence of type 2 diabetes, stratified by whether individuals had had a prior myocardial infarction. The results of the study are shown in the table. Yes No Yes No 8968 2352 461 90 Cumulative incidence, relative risks, and exposure attributable risks of Ml during a 7- year follow-up according to previous MI history and presence of type 2 diabetes. Diabetes Previous MI Incidence (%) RR AR in those with previous MI (6) 24.8 Reference 15.3 Reference 45.0 20.2 18.8 3.5 Incidence rates/100,000 78.7 127.1 309.7 384.9 2.2 1.0 5.4 1.0 d. What types of interaction can be inferred by inspection of the table? e. Is it appropriate to merely show a diabetes-adjusted measure of association? Why? 5. (20 points). The sensitivity of high levels of prostate specific antigen (PSA 4.0 ng/ml) to identify prostate cancer has ranged from 35% to 71% and specificity from 63% to 91%, with
Step by Step Solution
★★★★★
3.45 Rating (164 Votes )
There are 3 Steps involved in it
Step: 1
I see that the question description is 812 Question Description C W LOCK ANSWER NOW This question ...
Get Instant Access to Expert-Tailored Solutions
See step-by-step solutions with expert insights and AI powered tools for academic success
Step: 2

Step: 3
Ace Your Homework with AI
Get the answers you need in no time with our AI-driven, step-by-step assistance
Get Started
Elementary Statistics
Authors: Neil A. Weiss
8th Edition
321691237, 978-0321691231